By Segger Microcontroller Systems 132

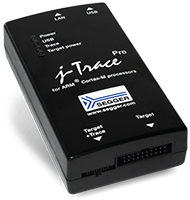
Segger Microcontroller Systems' J-Trace PRO is an advanced debug probe that supports the advanced tracing features of Arm® Cortex cores. It can capture complete instruction traces over long periods of time, thereby enabling the recording of infrequent, hard-to-reproduce bugs. This is particularly helpful when the program flow "runs off the rails" and stops in a fault state.
In combination with Segger's toolchain independent debug software, Ozone, and the extensive example project library, which includes the most popular target devices, J-Trace PRO users get the best possible trace experience.
The cross-platform Ozone debugger comes with the J-Trace PRO at no extra cost and can run alongside any development environment; including SEGGER's Embedded Studio IDE; users just need to provide an ELF file and basic configuration. This allows users to take advantage of the unlimited streaming trace providing live code coverage, profiling, timeline, power debugging, and more.
SystemView, Segger's tool which provides visual analysis of the user's running application, is free for use as well.