Expand menu
Hello, Sign in
My Account
0
Cart
Home
Products
Sensors
Semiconductors
Passive Components
Connectors
Power
Electromechanical
Optoelectronics
Circuit Protection
Integrated Circuits - ICs
Main Products
Manufacturers
Blog
Services
About OMO
About Us
Contact Us
Check Stock
STPS1L60ZF
P1-P3
P4-P6
P7-P9
P10-P12
P13-P15
Characteristics
STPS1L60
4/
15
DocID7504 Rev
10
1.1
Characteristics (curves)
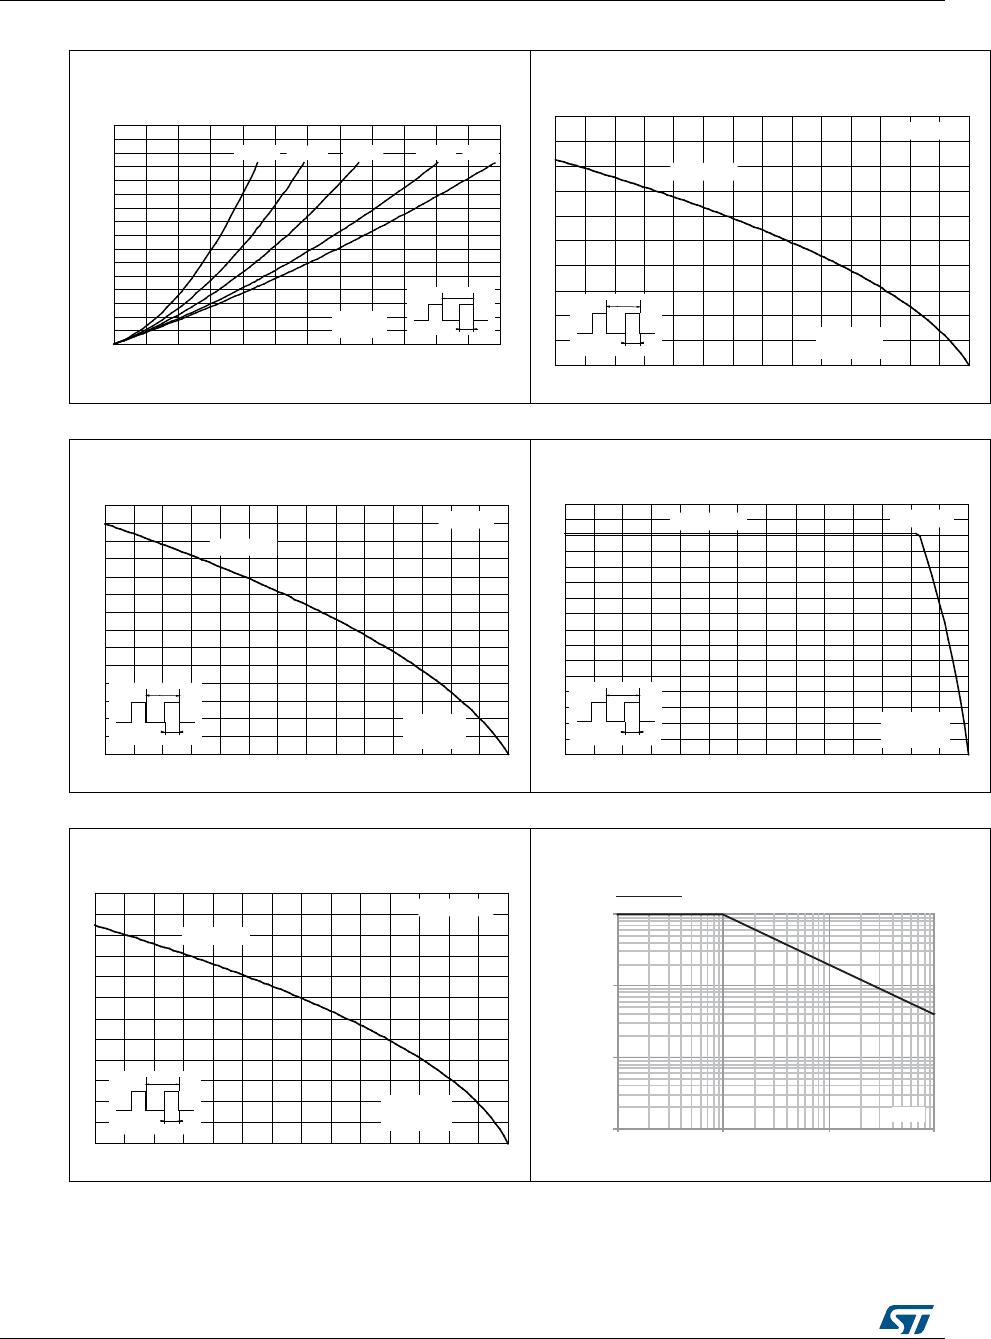
Figure 1: Average forward power dissipation
versus average forward current
Figure 2: Average forward current versus ambient
temperature (δ = 0.5)
Figure 3: Average forward current versus ambient
temperature (δ = 0.5)
Figure 4: Average forward current versus ambient
temperature (δ = 0.5)
Figure 5: Average forward current versus ambient
temperature (δ = 0.5)
Figure 6: Normalized avalanche power derating
versus pulse duration (T
j
= 125 °C)
0.0
0.1
0.2
0.3
0.4
0.5
0.6
0.7
0.8
0.0
0.2
0.4
0.6
0.8
1.0
1.2
δ
= 0.05
δ
= 0.1
δ
= 0.2
δ
= 0.5
δ
= 1
T
δ
=
tp
/
T
tp
P
F(A
V)
(W)
I
F(A
V)
(A)
0
1
2
3
4
5
0
25
50
75
1
00
125
1
50
175
R
th(
j-a)
= R
th(
j-l)
T
δ
=
t
p/
T
t
p
SMA
T
a
m
b
(°
C
)
I
F(A
V)
(A)
0.0
0.5
1.0
1.5
2.0
2.5
3.0
3.5
0
25
50
75
10
0
12
5
15
0
17
5
R
th(
j-a)
= R
th(
j-l)
T
δ
=
t
p/
T
t
p
DO-41
T
a
m
b
(°
C)
I
F(A
V)
(A)
I
F(A
V)
(A)
0.0
0.2
0.4
0.6
0.8
1.0
1.2
1.4
1.6
0
25
50
75
10
0
1
25
15
0
17
5
R
th(
j-a)
= R
th(
j-c)
T
δ
=
t
p/
T
t
p
STmite
flat
T
a
m
b
(°
C)
I
F(A
V)
(A)
0
1
2
3
4
5
6
0
25
50
75
10
0
12
5
15
0
17
5
R
th(
j-a)
= R
th(
j-l)
T
δ
=
t
p/
T
t
p
SOD12
3Flat
T
a
m
b
(°
C)
P
(t
p
)
P
(10
µ
s)
ARM
ARM
0.001
0.01
0.1
1
1
10
100
1000
t
(µ
s
)
p
STPS1L60
Characteristics
DocID7504 Rev
10
5/
15
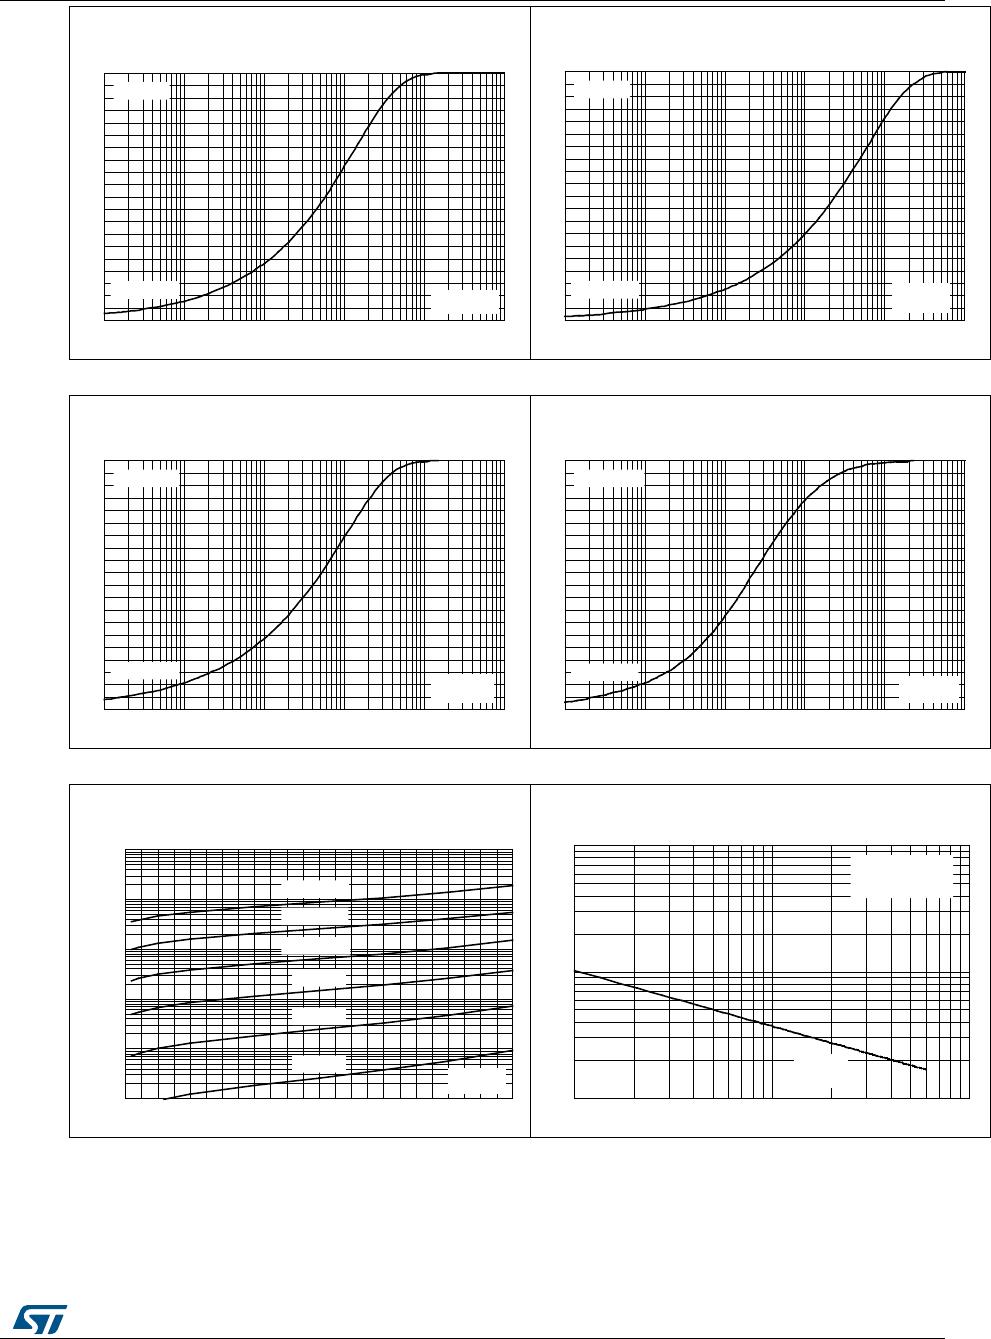
Figure 7: Relative variation of thermal impedance
junction to ambient versus pulse duration
Figure 8
:
Relative variation of thermal impedance
junction to ambient versus pulse duration
Figure 9: Relative variation of thermal impedance
junction to ambient versus pulse duration
Figure
10
: Relative variation of thermal impedance
junction to lead versus pulse duration
Figure
11
: Reverse leakage current versus reverse
voltage applied (typical values)
Figure
12
:
Junction capacitance versus reverse
voltage applied (typical values)
0.0
0.1
0.2
0.3
0.4
0.5
0.6
0.7
0.8
0.9
1.0
1.E-02
1.E-01
1.E+00
1.E+0
1
1.E+02
1.E+03
Single pulse
SMA
Z
th(j-a)
/R
th(j-a)
t
p
(s
)
Z
th(j-a)
/R
th(j-a)
0.0
0.1
0.2
0.3
0.4
0.5
0.6
0.7
0.8
0.9
1.0
1.E-02
1.E-01
1.E+0
0
1.E+01
1.E+02
1.E+03
Single pulse
DO-41
t
p
(s
)
Z
th(j-a)
/R
th(j-a)
0.0
0.1
0.2
0.3
0.4
0.5
0.6
0.7
0.8
0.9
1.0
1.E-02
1.E-01
1.E+0
0
1.E+01
1.
E
+02
1.E+03
Single pulse
STmite flat
t
p
(s
)
Z
th(j-l)
/R
th(j-l)
0.0
0.1
0.2
0.3
0.4
0.5
0.6
0.7
0.8
0.9
1.0
1.E-04
1.E-03
1.E-02
1.E-01
1.E+00
1.E+01
Single pulse
SOD123Fla
t
t
p
(s
)
1.E-03
1.E-02
1.E-01
1.E+00
1.E+01
1.E+02
0
5
10
15
20
25
30
35
40
45
50
55
60
T
j
= 150 °C
T
j
= 125 °C
T
j
= 25 °C
T
j
= 100 °C
T
j
= 75 °C
T
j
= 50 °C
V
R
(V)
I
R
(mA)
10
10
0
10
00
1
10
10
0
F = 1 M
Hz
V
O
SC
= 30 mV
RM
S
T
j
= 25 °C
C(pF)
V
R
(V
)
Characteristics
STPS1L60
6/
15
DocID7504 Rev
10
0
20
40
60
80
100
12
0
5
10
15
20
25
R
th(
j-a)
R
th(
j-l)
DO-41
R
th
(°C/W)
L
leads
(mm)
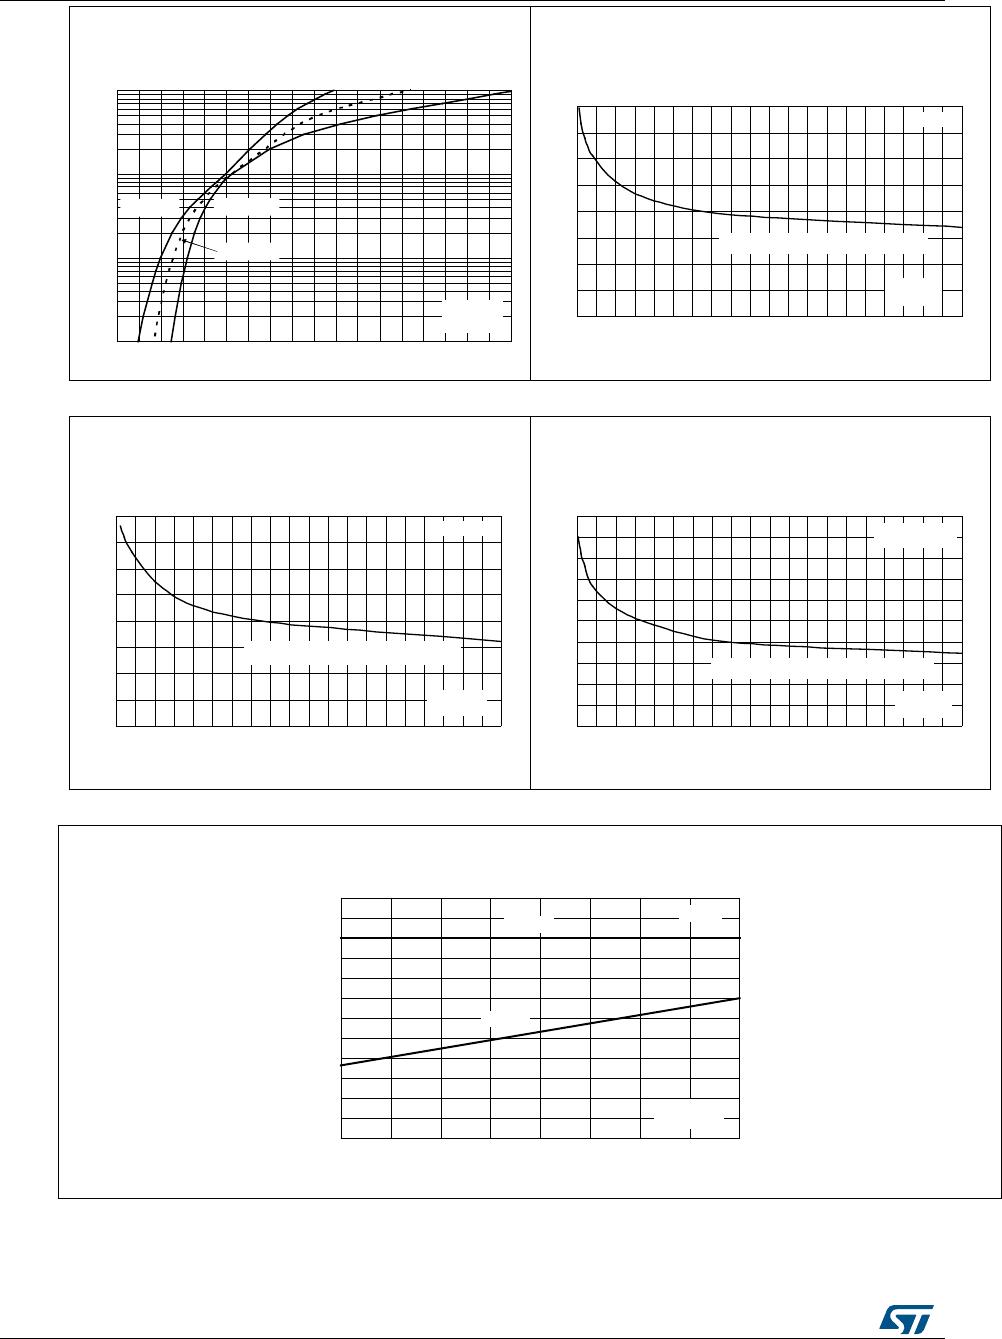
Figure
13
: Forward voltage drop versus forward
current (typical values)
Figure
14
: Thermal resistance junction to ambient
versus copper surface under each lead
(typical values)
Figure
15
: Thermal resistance junction to ambient
versus copper surface under tab (typical values)
Figure
16
:
Thermal resistance junction to ambient
versus copper surface under each lead
(typical values)
Figure
17
: Thermal resistance versus lead length
0.0
1
0.1
0
1.0
0
10
.
0
0
0.0
0.2
0.4
0.6
0.8
1.0
1.2
1.4
1.6
1.8
T
j
= 25 °C
T
j
= 125 °C
T
j
= 75 °C
I
F
(A)
V
F
(V)
0
50
10
0
15
0
20
0
0.0
0.5
1.0
1.5
2.0
2.5
3.0
3.5
4.0
4.5
5.0
SMA
R
th(j-a)
(°C/W)
S
C
u
(cm²)
Epoxy printed board FR4, e
Cu
= 35 µm
R
th(j-a)
(°C/W)
0
50
100
150
200
0.0
0.
5
1.0
1.5
2.0
2.5
3.
0
3.5
4.0
4.5
5.0
STmite flat
S
Cu
(cm²)
Epoxy printed board FR4, e
Cu
= 35 µm
R
th(
j-a)
(°C/W)
0
50
100
150
200
250
0.0
0.
5
1.0
1.5
2.0
2.5
3.
0
3.5
4.0
4.5
5.0
S
C
u
(cm
²)
Epoxy printed board FR4, e
Cu
= 35 µm
SOD123Flat
P1-P3
P4-P6
P7-P9
P10-P12
P13-P15
STPS1L60ZF
Mfr. #:
Buy STPS1L60ZF
Manufacturer:
STMicroelectronics
Description:
Schottky Diodes & Rectifiers Low Drop Power Schottky Rectifier
Lifecycle:
New from this manufacturer.
Delivery:
DHL
FedEx
Ups
TNT
EMS
Payment:
T/T
Paypal
Visa
MoneyGram
Western
Union
Products related to this Datasheet
STPS1L60RL
STPS1L60ZF
STPS1L60A
STPS1L60
STPS1L60MF