4
Typical Performance Curve (at Tc=25°C, unless specied otherwise)
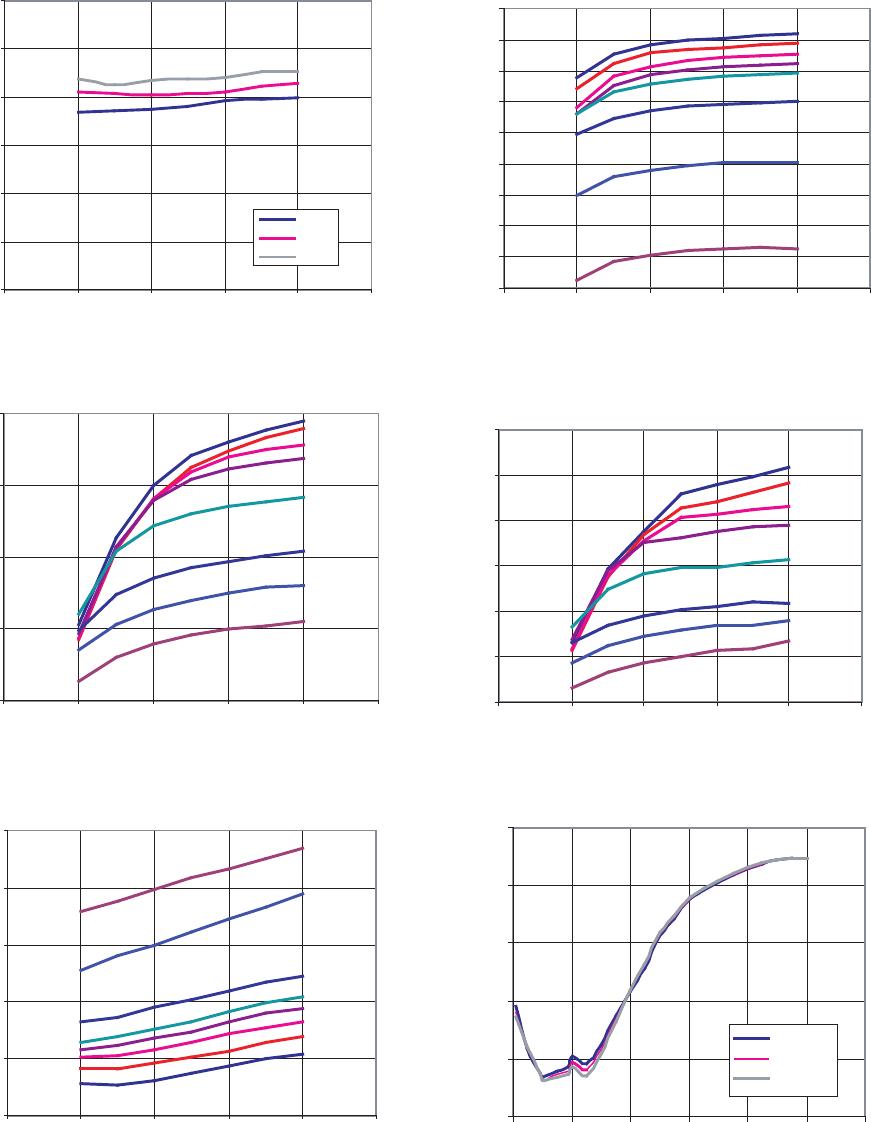
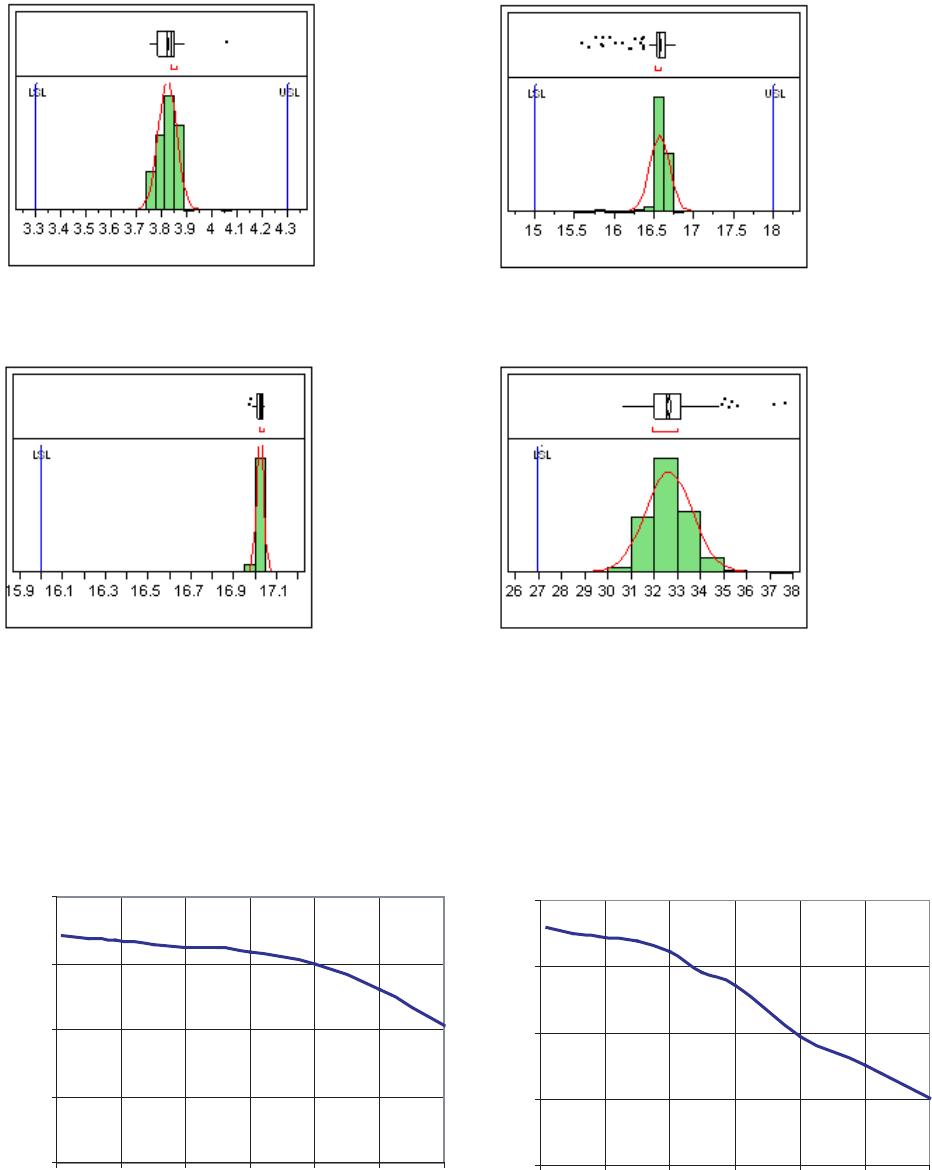
Figure 5. Gain vs Frequency at Id = 60 mA.
Figure 6. P1dB vs Frequency at Id = 60 mA.
Notes:
1. Statistics distribution determined from a sample size of 500 parts taken from 3 dierent wafers.
2. Future wafers allocated to this product may have typical values anywhere between the minimum and maximum specication limits.
Product Consistency Distribution Charts at 900 MHz, Id=60mA
Figure 1. Vd Distribution@60mA.
LSL=3.3V, Nominal=3.8V, USL=4.3V
Figure 2. Gain Distribution@60mA.
LSL=15 dB, Nominal=16.5 dB, USL=18 dB
Figure 3. P1dB Distribution@60mA
LSL=16.0 dBm, Nominal=17.1dBm
Figure 4. OIP3 Distribution@60mA.
LSL=27 dBm, Nominal=32.6 dBm
0
5
10
15
20
0 1 2 3 4 5 6
Frequency (GHz)
Gain (dB)
0
5
10
15
20
0 1 2 3 4 5 6
Frequency (GHz)
P1dB (dBm)