Expand menu
Hello, Sign in
My Account
0
Cart
Home
Products
Sensors
Semiconductors
Passive Components
Connectors
Power
Electromechanical
Optoelectronics
Circuit Protection
Integrated Circuits - ICs
Main Products
Manufacturers
Blog
Services
About OMO
About Us
Contact Us
Check Stock
OP249GSZ-REEL
P1-P3
P4-P6
P7-P9
P10-P12
P13-P15
P16-P18
P19-P19
Data Sheet
OP249
Rev.
I
| P
age
9
of
18
0.1
0.01
20
100
1k
10k
20k
T
A
= 25°
C
V
S
= ±15V
V
O
= 10V p
-p
R
L
=
10kΩ
A
V
= 1
00296-018
Figure
18
.
Distortion
vs. Frequency
0.1
0.01
20
100
1k
10k
20k
T
A
= 25°
C
V
S
= ±15V
V
O
= 10V p
-p
R
L
=
2kΩ
A
V
= 10
00296-019
Figure
19
.
Distortion
vs. Frequency
0.1
0.01
20
100
1k
10k
20k
T
A
= 25°
C
V
S
= ±15V
V
O
= 10V p
-p
R
L
=
600kΩ
A
V
= 10
00296-020
Figure
20
.
Distortion
vs. Frequency
BANDWI
DTH (
0.1Hz T
O
10Hz)
T
A
= 25°
C, V
S
= ±15V
+1µV
–1µV
500mV
1s
00296-021
Figure
21
.
Low Frequen
cy Noise
10
0
–10
60
50
40
30
20
–20
T
A
= 25°
C
V
S
= ±15V
A
VCL
= 100
A
VCL
= 10
A
VCL
= 5
A
VCL
= 1
FREQ
UENCY
(Hz)
1k
10k
100k
1M
10M
100M
CLOS
ED-
LOOP GAIN (
dB)
00296-022
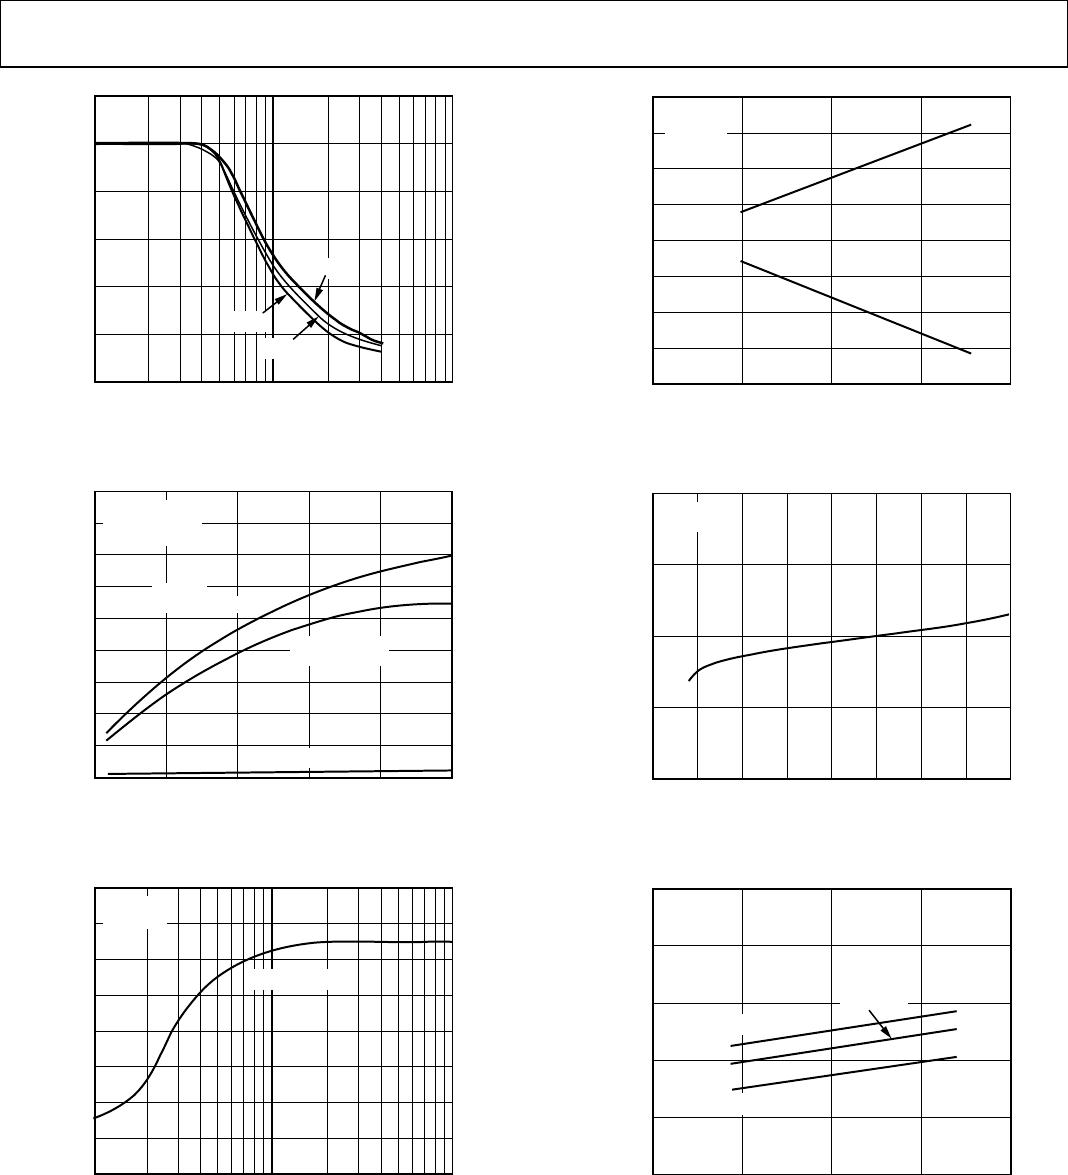
Figure
22
.
Closed
-
L
oop Gain
vs. Frequency
10
0
50
40
30
20
FREQ
UENCY
(Hz)
100
1k
10k
100k
1M
10M
IMPEDANCE (Ω
)
T
A
= 25°
C
V
S
= ±15V
A
VCL
= 1
A
VCL
= 10
A
VCL
= 100
00296-023
Figure
23
.
Closed
-
Loop Output
Impedance vs. F
requency
OP249
Data Sheet
Rev.
I
| P
age
10
of
18
25
20
15
10
0
1k
30
5
1M
10M
FREQ
UENCY
(Hz)
OUTP
UT VOLTA
GE (V p-p)
AD8512
AD712
OP249
00296-024
Figure
24
.
Output Voltage vs. Fr
equency
60
50
40
30
20
10
0
70
80
90
LO
AD CAPACI
TANCE (
pF
)
0
100
200
300
400
500
OVERSHOOT (%)
A
VCL
= 1
POSITI
VE EDGE
A
VCL
= 5
A
VCL
= 1
NEGATIVE EDGE
V
S
= ±15V
R
L
=
2kΩ
V
IN
= 100mV p
-p
00296-025
Figure
25
.
Small Overshoot v
s. Load Capacitance
14
12
10
8
0
16
6
4
2
LO
AD RES
IST
ANCE
(Ω)
100
1k
10k
MAXIMUM OUTPUT SWING (V)
+V
OHM
= |–V
OHM
|
T
A
= 25°
C
V
S
= ±15V
00296-026
Figure
26
.
Maximum Output Voltage
Swing
vs. Load Re
sistance
–20
–15
–10
–5
0
5
10
15
20
0
±5
±10
±15
±20
SUPPLY VOLT
AGE (V)
OUTP
UT VOLTA
GE SWING (
V)
T
A
= 25°
C
R
L
=
2kΩ
00296-027
Figure
27
.
Output Voltage Swi
ng vs. Supply Voltage
5.2
5.4
5.6
5.8
6.0
TEMPERATURE (°C)
–75
–50
–25
0
25
50
75
100
125
V
S
= ±15V
NO LOA
D
SUPPL
Y CURRE
NT (mA)
00296-028
Figure
28
.
Supply Curren
t vs. Temperat
ure
5.0
5.2
5.4
5.6
5.8
6.0
SUPPLY VOLT
AGE (V)
0
5
10
15
20
SUPPL
Y CURRE
NT (mA)
T
A
= –55°
C
T
A
= +125°
C
T
A
= +25°
C
00296-029
Figure
29
.
Supply Curren
t vs. Supply
Voltage
Data Sheet
OP249
Rev.
I
| P
age
11
of
18
UNIT
S
160
180
140
120
100
80
60
40
20
0
–1000
–800
–600
–400
–200
0
200
400
600
800
1000
V
OS
(µV)
T
A
= 25°
C
V
S
= ±15V
415 × OP
249
(830
OP AMPS)
00296-030
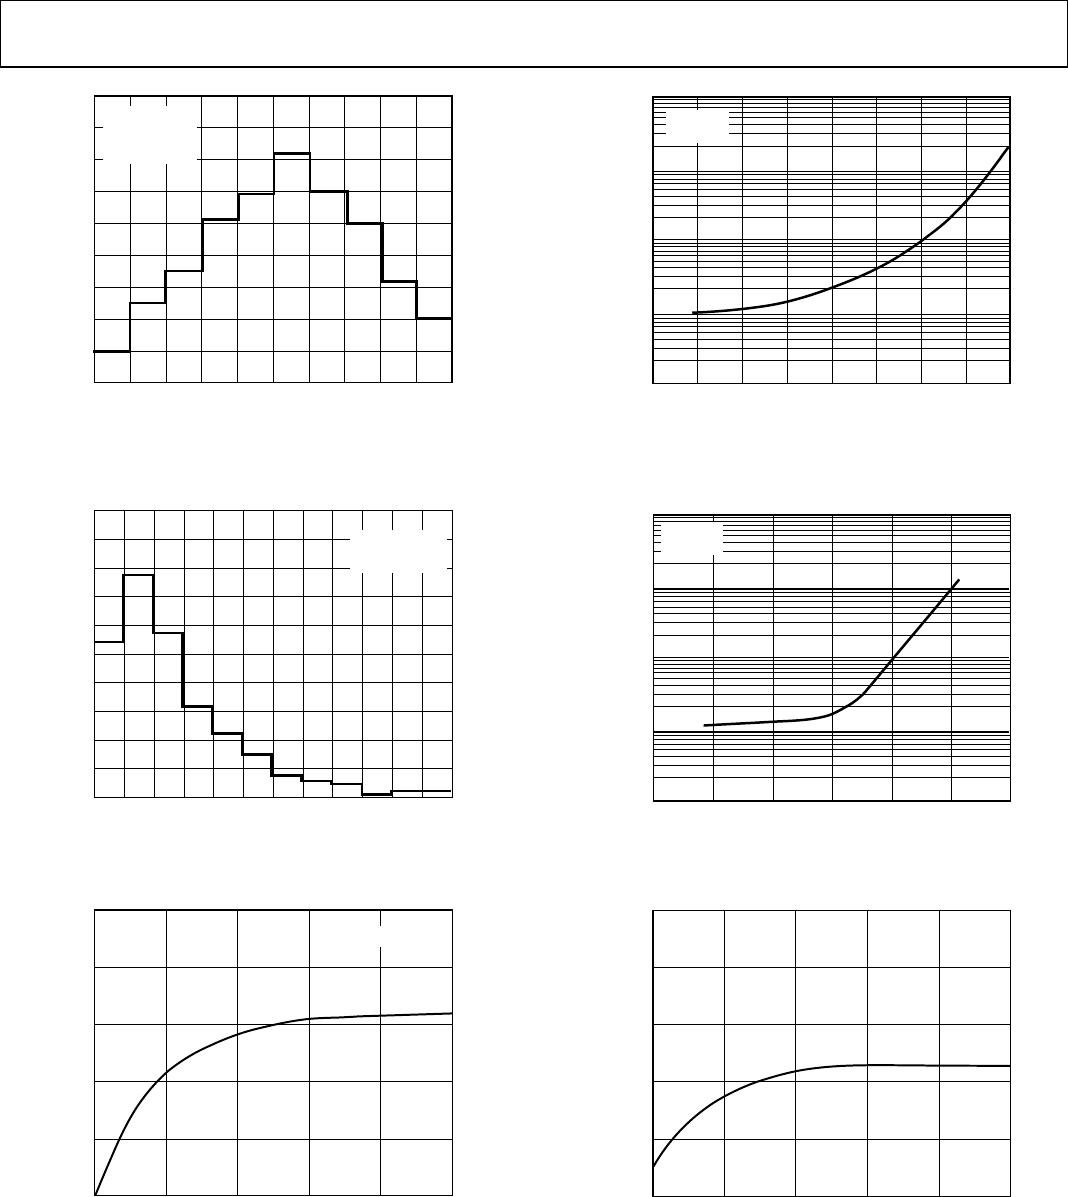
Figure
30
.
V
OS
Distribution (
N-8)
UNIT
S
240
300
210
180
150
120
90
60
30
0
270
0
2
4
6
8
10
12
14
16
18
20
22
24
TCV
OS
(µV/°C)
V
S
= ±15V
–40°C T
O +
85°C
(830
OP AMPS)
00296-031
Figure
31
.
TCV
OS
Distribution (
N-8)
50
20
30
0
40
10
TIME AFT
ER POWER APPLIED (Minutes)
0
1
2
3
4
5
OFFSET V
OLTAGE
(µV)
V
S
= ±15V
00296-032
Figure
32
.
Offset Voltage Warm
-
Up Drift
100
1k
10k
10
1
TEMPERATURE (°C)
–75
–50
–25
0
25
50
75
100
125
V
S
= ±15V
V
CM
= 0V
INPUT
BI
AS CURRENT
(p
A)
00296-033
Figure
33
.
Input B
ias Current vs
. Temperature
COMMON-MODE VOLTAGE (V)
–15
–10
–5
0
5
10
15
10
4
10
3
10
2
10
1
10
0
T
A
= 25°
C
V
S
= ±15V
BIAS CURRE
NT (
pA)
00296-034
Figure
34
.
Bias Current vs. Com
mon
-
Mode Voltage
50
20
30
0
40
10
INPUT
BI
AS CURRENT
(p
A)
T
A
= 25°
C
V
S
= ±15V
TIME AFT
ER POWER APPLIED (Minutes)
0
2
4
6
8
10
00296-035
Figure
35
.
Bias Curren
t Warm
-
U
p Drift
P1-P3
P4-P6
P7-P9
P10-P12
P13-P15
P16-P18
P19-P19
OP249GSZ-REEL
Mfr. #:
Buy OP249GSZ-REEL
Manufacturer:
Analog Devices Inc.
Description:
Precision Amplifiers DUAL PREC JFET IC High Speed
Lifecycle:
New from this manufacturer.
Delivery:
DHL
FedEx
Ups
TNT
EMS
Payment:
T/T
Paypal
Visa
MoneyGram
Western
Union
Products related to this Datasheet
OP249GPZ
OP249GSZ
OP249AZ
OP249GSZ-REEL
OP249GSZ-REEL7
OP249FZ
OP249GP
OP249GS
OP249GS-REEL
OP249GS-REEL7