Performance
Measured performance can vary for a number of reasons. The major factors affecting
drive performance are the capacity of the drive and the interface/HBA of the host. Addi-
tionally, overall system performance can affect the measured drive performance. When
comparing drives, it is recommended that all system variables are the same, and only
the drive being tested varies.
Performance numbers will vary depending on the host system configuration. Perform-
ance is measured using a single drive direct attached (no RAID) to an integrated SATA
controller.
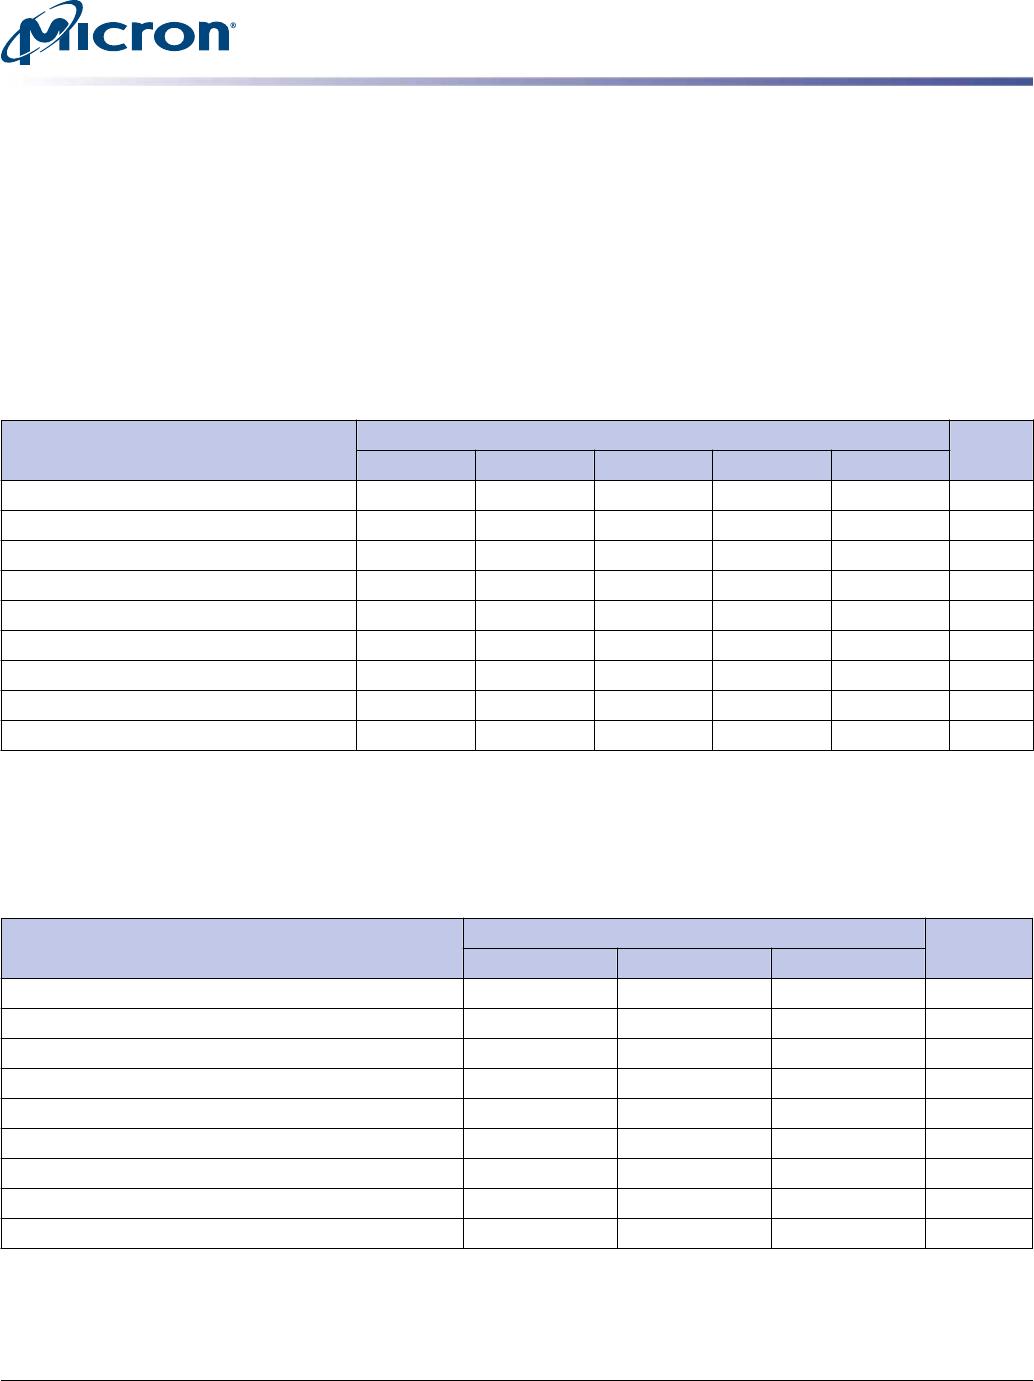
Table 1: Drive Performance – ECO 2.5"
Parameter
Capacity
Unit480GB 960GB 1920GB 3840GB 7680GB
Sequential read (128KB transfer) 540 540 540 540 540 MB/s
Sequential write (128KB transfer) 380 520 520 520 520 MB/s
Random read (4KB transfer) 93,000 93,000 93,000 93,000 93,000 IOPS
Random write (4KB transfer) 31,000 28,000 24,000 18,000 9000 IOPS
Random 70/30 R/W (4KB transfer) 49,000 47,000 43,000 36,000 21,000 IOPS
READ latency (99.9%) 500 500 500 500 500 µs
WRITE latency (99.9%) 500 500 500 500 500 µs
READ latency (99.999%) 9.0 9.0 9.0 9.0 9.0 ms
WRITE latency (99.999%) 5.0 5.0 5.0 5.0 5.0 ms
Notes:
1. Performance measured using FIO with a queue depth of 32 in the steady state region.
2. 4KB transfers with a queue depth of 1 are used to measure READ/WRITE latency values.
3. System variations and HBA used will affect measured results.
Table 2: Drive Performance – ECO M.2.
Parameter
Capacity
Unit480GB 960GB 1920GB
Sequential read (128KB transfer) 540 540 540 MB/s
Sequential write (128KB transfer) 380 520 520 MB/s
Random read (4KB transfer) 93,000 93,000 93,000 IOPS
Random write (4KB transfer) 31,000 28,000 24,000 IOPS
Random 70/30 R/W (4KB transfer) 49,000 42,000 39,000 IOPS
READ latency (99.9%) 500 500 500 µs
WRITE latency (99.9%) 500 500 500 µs
READ latency (99.999%) 9.0 9.0 9.0 ms
WRITE latency (99.999%) 5.0 5.0 5.0 ms
Notes:
1. Performance measured using FIO with a queue depth of 32 in the steady state region.
2. 4KB transfers with a queue depth of 1 are used to measure READ/WRITE latency values.
3. System variations and HBA used will affect measured results.
5100 Series NAND Flash SSD
Performance
CCMTD-1725822587-10309
5100_series_SSD_disti.pdf - Rev. C 08/17 EN
4
Micron Technology, Inc. reserves the right to change products or specifications without notice.
© 2016 Micron Technology, Inc. All rights reserved.
Table 3: Drive Performance – PRO 2.5"
Parameter
Capacity
Unit240GB 480GB 960GB 1920GB 3840GB
Sequential read (128KB transfer) 540 540 540 540 540 MB/s
Sequential write (128KB transfer) 250 410 520 520 520 MB/s
Random read (4KB transfer) 78,000 93,000 93,000 93,000 93,000 IOPS
Random write (4KB transfer) 26,000 43,000 37,000 37,000 30,000 IOPS
Random 70/30 R/W (4KB transfer) 43,000 55,000 54,000 57,000 54,000 IOPS
READ latency (99.9%) 500 500 500 500 500 µs
WRITE latency (99.9%) 500 500 500 500 500 µs
READ latency (99.999%) 9.0 9.0 9.0 9.0 9.0 ms
WRITE latency (99.999%) 5.0 5.0 5.0 5.0 5.0 ms
Notes:
1. Performance measured using FIO with a queue depth of 32 in the steady state region.
2. 4KB transfers with a queue depth of 1 are used to measure READ/WRITE latency values.
3. System variations and HBA used will affect measured results.
Table 4: Drive Performance – PRO M.2.
Parameter
Capacity
Unit240GB 480GB 960GB 1920GB
Sequential read (128KB transfer) 540 540 540 540 MB/s
Sequential write (128KB transfer) 250 410 520 520 MB/s
Random read (4KB transfer) 78,000 93,000 93,000 93,000 IOPS
Random write (4KB transfer) 26,000 43,000 37,000 37,000 IOPS
Random 70/30 R/W (4KB transfer) 43,000 55,000 54,000 57,000 IOPS
READ latency (99.9%) 500 500 500 500 µs
WRITE latency (99.9%) 500 500 500 500 µs
READ latency (99.999%) 9.0 9.0 9.0 9.0 ms
WRITE latency (99.999%) 5.0 5.0 5.0 5.0 ms
Notes:
1. Performance measured using FIO with a queue depth of 32 in the steady state region.
2. 4KB transfers with a queue depth of 1 are used to measure READ/WRITE latency values.
3. System variations and HBA used will affect measured results.
5100 Series NAND Flash SSD
Performance
CCMTD-1725822587-10309
5100_series_SSD_disti.pdf - Rev. C 08/17 EN
5
Micron Technology, Inc. reserves the right to change products or specifications without notice.
© 2016 Micron Technology, Inc. All rights reserved.
Table 5: Drive Performance – MAX
Parameter
Capacity
Unit240GB 480GB 960GB 1920GB
Sequential read (128KB transfer) 540 540 540 540 MB/s
Sequential write (128KB transfer) 310 460 520 520 MB/s
Random read (4KB transfer) 93,000 93,000 93,000 93,000 IOPS
Random write (4KB transfer) 48,000 74,000 74,000 66,000 IOPS
Random 70/30 R/W (4KB transfer) 57,000 70,000 72,000 70,000 IOPS
READ latency (99.9%) 500 500 500 500 µs
WRITE latency (99.9%) 500 500 500 500 µs
READ latency (99.999%) 9.0 9.0 9.0 9.0 ms
WRITE latency (99.999%) 5.0 5.0 5.0 5.0 ms
Notes:
1. Performance measured using FIO with a queue depth of 32 in the steady state region.
2. 4KB transfers with a queue depth of 1 are used to measure READ/WRITE latency values.
3. System variations and HBA used will affect measured results.
5100 Series NAND Flash SSD
Performance
CCMTD-1725822587-10309
5100_series_SSD_disti.pdf - Rev. C 08/17 EN
6
Micron Technology, Inc. reserves the right to change products or specifications without notice.
© 2016 Micron Technology, Inc. All rights reserved.

MTFDDAK240TCB-1AR16ABYY

Mfr. #:
Manufacturer:
Micron
Description:
Solid State Drives - SSD 5100 240GB 2.5in SSD
Lifecycle:
New from this manufacturer.
Delivery:
DHL FedEx Ups TNT EMS
Payment:
T/T Paypal Visa MoneyGram Western Union