Table 4: Signal Assignments
Primary Side Secondary Side
Pin # Signal Name Description Pin # Signal Name Description
1 GND (PRESENCE) Ground 2 3V3 +3.3V
3 GND Ground 4 3V3 +3.3V
5 GND No connect 6 Reserved No connect
7 DNU No connect 8 Reserved No connect
9 DNU Ground 10 DAS/DSS Drive activity (host
LED)
11 GND Ground Key
Key 20 Reserved No connect
21 GND (Direct to P69) No connect 22 Reserved No connect
23 DNU No connect 24 Reserved No connect
25 DNU No connect 26 Reserved No connect
27 GND Ground 28 Reserved No connect
29 Reserved No connect 30 Reserved No connect
31 Reserved No connect 32 Reserved No connect
33 GND Ground 34 Reserved No connect
35 Reserved No connect 36 Reserved No connect
37 Reserved No connect 38 DEVSLP Device sleep
39 GND Ground 40 Reserved No connect
41 SATA +B SATA B differential
pair
42 Reserved No connect
43 SATA -B 44 Reserved No connect
45 GND Ground 46 Reserved No connect
47 SATA -A SATA A differential
pair
48 Reserved No connect
49 SATA +A 50 Reserved No connect
51 GND Ground 52 Reserved No connect
53 Reserved No connect 54 Reserved No connect
55 Reserved No connect 56 Reserved Vendor use
57 GND Ground 58 Reserved Vendor use
Key Key
67 DNU No connect 68 SUSCLK No connect
69 PEDET Ground 70 3V3 +3.3V
71 GND Ground 72 3V3 +3.3V
73 GND Ground 74 3V3 +3.3V
75 GND Ground
M600 M.2 Type 2260/2280 NAND Flash SSD
Interface Connectors
PDF: 09005aef859ad464
m600_m2_2260_2280_ssd.pdf - Rev. E 3/15 EN
7
Micron Technology, Inc. reserves the right to change products or specifications without notice.
© 2014 Micron Technology, Inc. All rights reserved.
Performance
Measured performance can vary for a number of reasons. The major factors affecting
drive performance are the capacity of the drive and the interface of the host. Addition-
ally, overall system performance can affect the measured drive performance. When
comparing drives, it is recommended that all system variables are the same, and only
the drive being tested varies.
Performance numbers will vary depending on the host system configuration.
For SSDs designed for the client computing market, Micron specifies performance in
fresh-out-of-box (FOB) state. Data throughput measured in "steady state" may be lower
than FOB state, depending on the nature of the data workload.
For a description of these performance states and of Micron's best practices for per-
formance measurement, refer to Micron's technical marketing brief Best Practices for
SSD Performance Measurement.
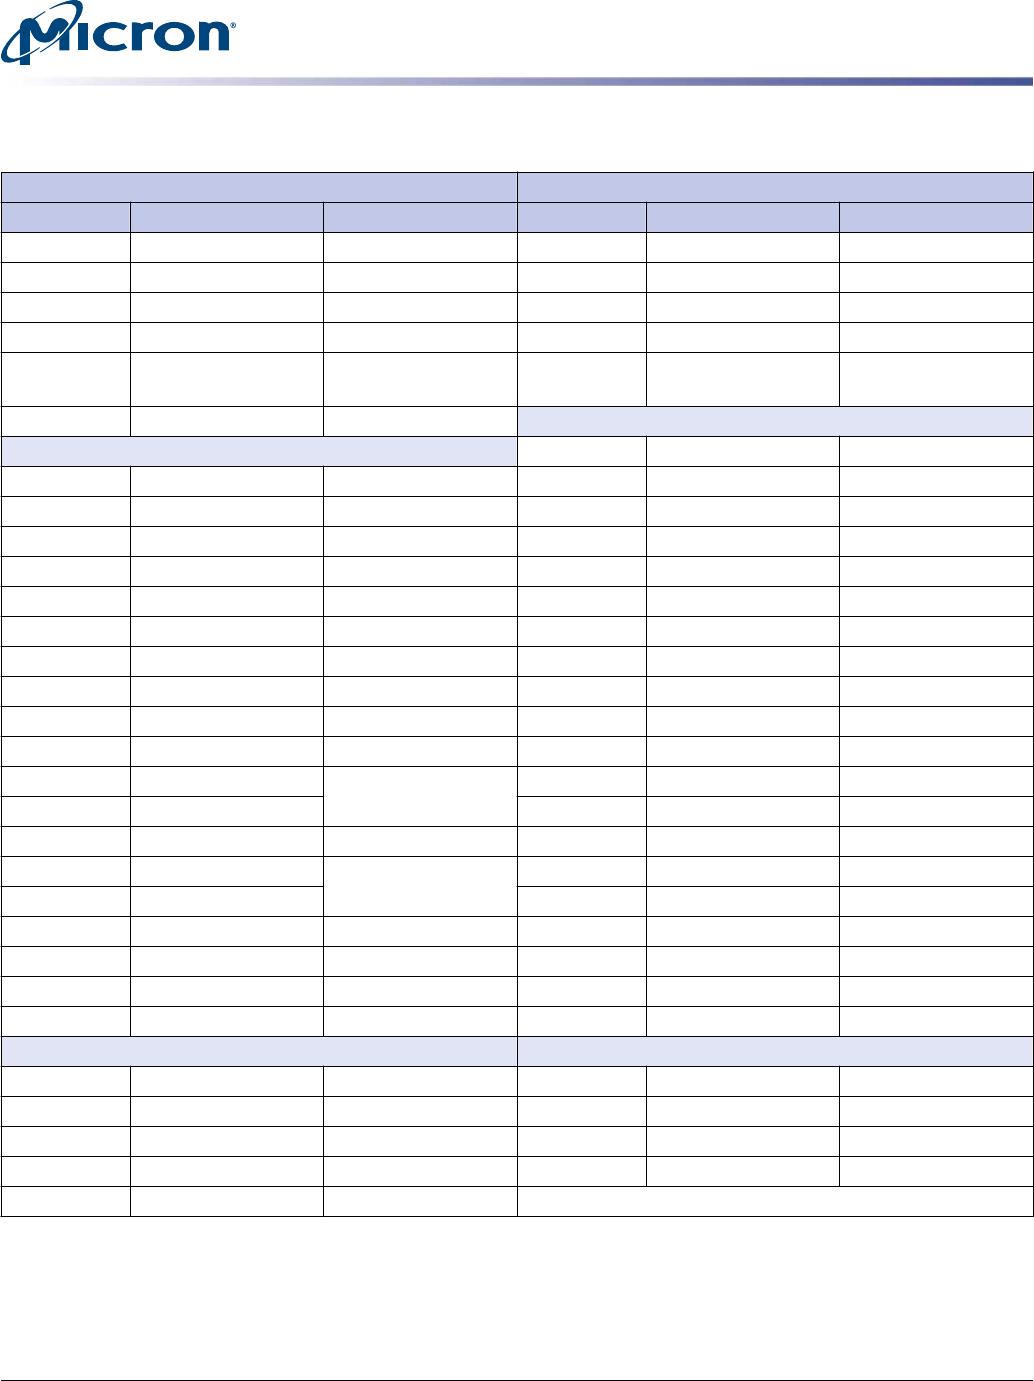
Table 5: Drive Performance
Capacity 128GB 256GB 512GB
UnitInterface Speed 6 Gb/s 6 Gb/s 6 Gb/s
PCMark Vantage 87,000 87,000 87,000 HDD score
Sequential read (128KB transfer) 560 560 560 MB/s
Sequential write (128KB transfer) 400 510 510 MB/s
Random read (4KB transfer) 90,000 100,000 100,000 IOPS
Random write (4KB transfer) 88,000 88,000 88,000 IOPS
READ latency (TYP) 120 120 120 µs
WRITE latency (TYP) 30 30 30 µs
Notes:
1. Performance numbers are maximum values, except as noted.
2. Typical I/O performance numbers as measured using Iometer with a queue depth of 32
and write cache enabled. Fresh-out-of-box (FOB) state is assumed. For performance
measurement purposes, the SSD may be restored to FOB state using the secure erase
command.
3. Iometer measurements are performed on an 20GB span of logical block addresses
(LBAs).
4. 4KB transfers with a queue depth of 1 are used to measure READ/WRITE latency values
with write cache enabled.
5. System variations will affect measured results. For comparison, PCMark scores are meas-
ured with the SSD as a secondary drive in a two-drive system. When measured as an OS
drive, system overhead can cause lower scores.
M600 M.2 Type 2260/2280 NAND Flash SSD
Performance
PDF: 09005aef859ad464
m600_m2_2260_2280_ssd.pdf - Rev. E 3/15 EN
8
Micron Technology, Inc. reserves the right to change products or specifications without notice.
© 2014 Micron Technology, Inc. All rights reserved.
Reliability
Micron’s SSDs incorporate advanced technology for defect and error management.
They use various combinations of hardware-based error correction algorithms and
firmware-based static and dynamic wear-leveling algorithms.
Over the life of the SSD, uncorrectable errors may occur. An uncorrectable error is de-
fined as data that is reported as successfully programmed to the SSD but when it is read
out of the SSD, the data differs from what was programmed.
Table 6: Uncorrectable Bit Error Rate
Uncorrectable Bit Error Rate Operation
<1 sector per 10
15
bits read READ
Mean Time To Failure
Mean time to failure (MTTF) for the SSD can be predicted based on the component reli-
ability data using the methods referenced in the Telcordia SR-332 reliability prediction
procedures for electronic equipment.
Table 7: MTTF
Capacity MTTF (Operating Hours)
1
128GB 1.5 million
256GB 1.5 million
512GB 1.5 million
Note:
1. The product achieves a mean time to failure (MTTF) of 1.5 million hours, based on popu-
lation statistics not relevant to individual units.
M600 M.2 Type 2260/2280 NAND Flash SSD
Reliability
PDF: 09005aef859ad464
m600_m2_2260_2280_ssd.pdf - Rev. E 3/15 EN
9
Micron Technology, Inc. reserves the right to change products or specifications without notice.
© 2014 Micron Technology, Inc. All rights reserved.

MTFDDAV512MBF-1AN12ABYY

Mfr. #:
Manufacturer:
Micron
Description:
SSD 512GB M.2 MLC SATA III 3.3V
Lifecycle:
New from this manufacturer.
Delivery:
DHL FedEx Ups TNT EMS
Payment:
T/T Paypal Visa MoneyGram Western Union