TC4426AM/TC4427AM/TC4428AM
DS21939B-page 4 2005-2013 Microchip Technology Inc.
2.0 TYPICAL PERFORMANCE CURVES
Note: Unless otherwise indicated, over operating temperature range with 4.5V V
DD
18V.
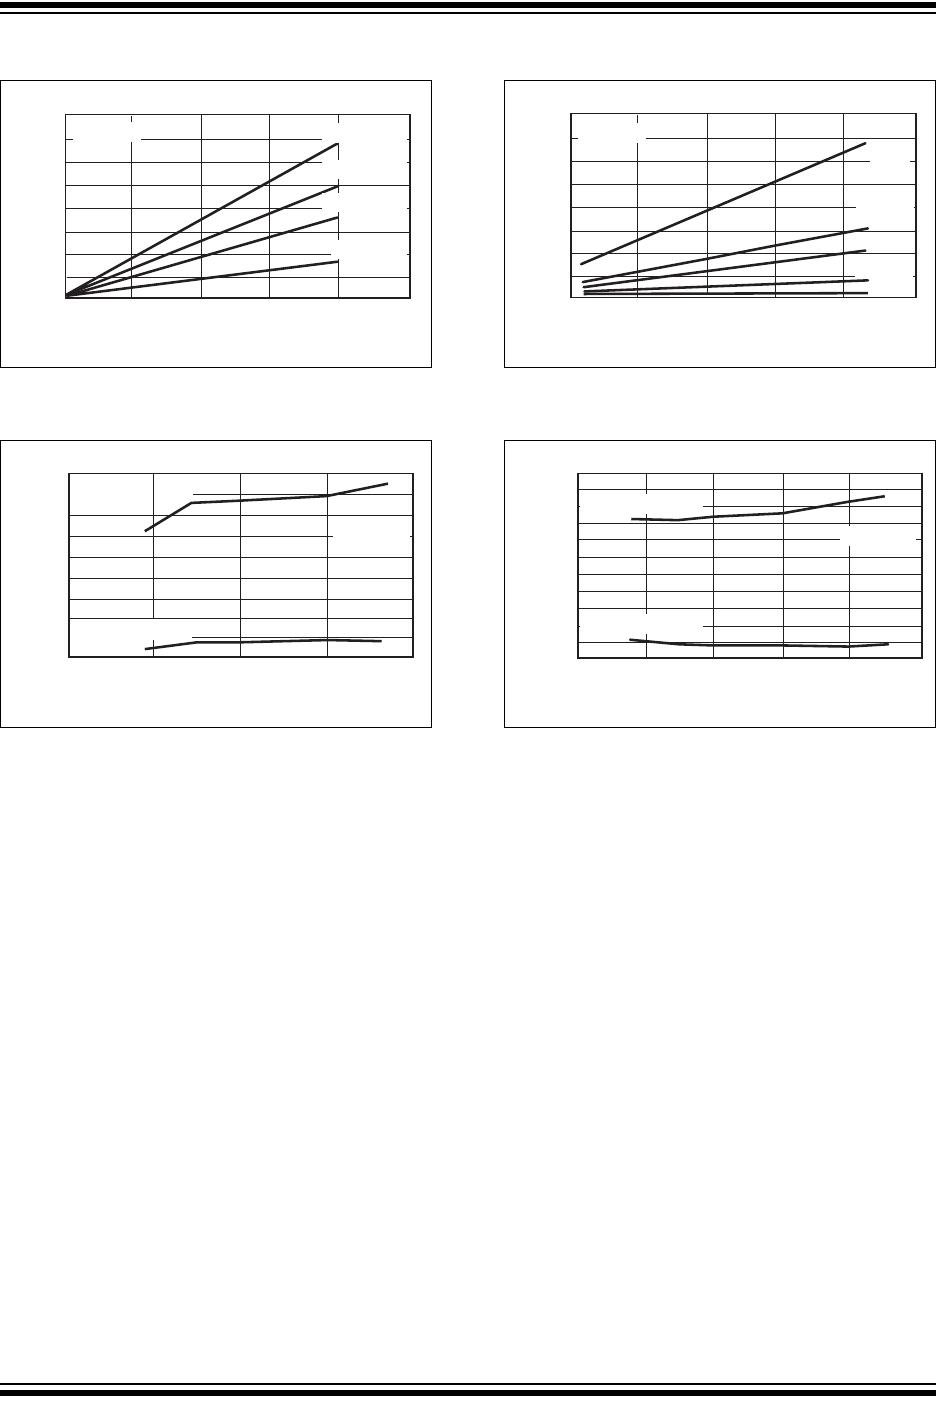
FIGURE 2-1: Rise Time vs. Supply
Voltage.
FIGURE 2-2: Delay Time vs. Input
Amplitude.
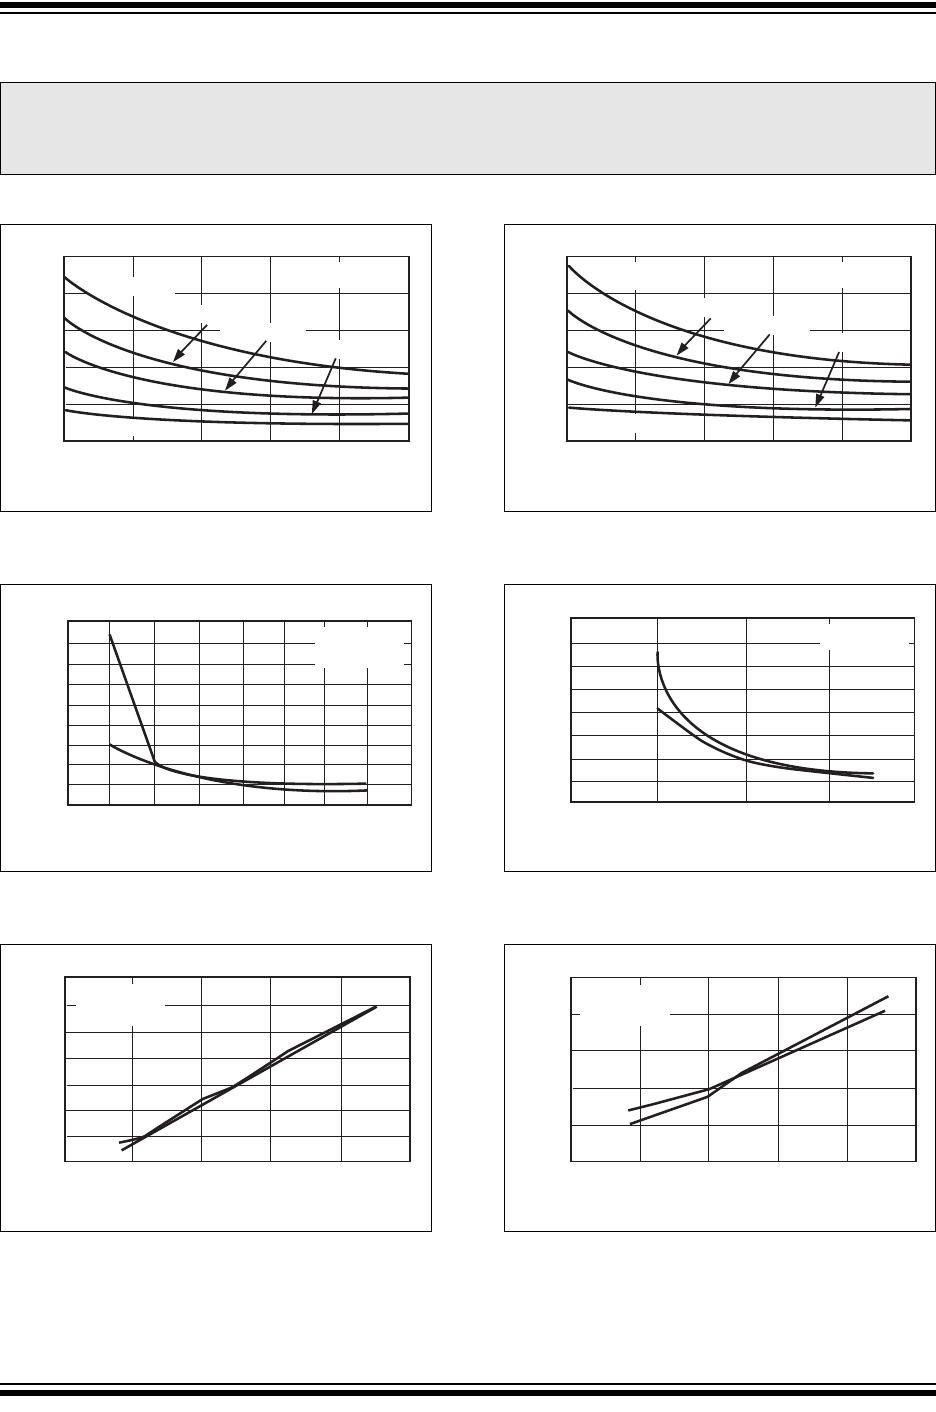
FIGURE 2-3: Rise and Fall Times vs.
Temperature.
FIGURE 2-4: Fall Time vs. Supply
Voltage.
FIGURE 2-5: Propagation Delay Time vs.
Supply Voltage.
FIGURE 2-6: Propagation Delay Time vs.
Temperature.
Note: The graphs and tables provided following this note are a statistical summary based on a limited number of
samples and are provided for informational purposes only. The performance characteristics listed herein
are not tested or guaranteed. In some graphs or tables, the data presented may be outside the specified
operating range (e.g., outside specified power supply range) and therefore outside the warranted range.
5.0
7.5 10.0 12.5 15.0 17.5
0
20
40
60
80
100
T
A
= +25
°C
V
DD
(V)
C
L
= 2200 pF
C
L
= 1500 pF
C
L
= 100 pF
C
L
= 1000 pF
C
L
= 470 pF
t
RISE
(nsec)
12 3 4 5 67 8 9
20
70
60
50
40
30
80
90
100
110
Delay Time (nsec)
Input Amplitude (V)
C
L
= 1000 pF
V
DD
= 10V
t
D1
t
D2
-100 -50 0 50 100 150
24
22
20
18
16
14
26
28
Time (nsec)
C
L
= 1000 pF
V
DD
= 18V
TEMPERATURE (
°
C)
t
FALL
t
RISE
5.0 7.5 10.0 12.5 15.0 17.5
0
20
40
60
80
100
C
L
= 100pF
T
A
= +25
°C
V
DD
(V)
C
L
= 2200pF
C
L
= 2200 pF
C
L
= 1500 pF
C
L
= 100 pF
C
L
= 1000 pF
C
L
= 470 pF
t
FALL
(nsec)
0 5 10 15 20
50
45
40
35
30
25
20
55
60
Delay Time (nsec)
V
DD
(V)
C
L
= 1000 pF
t
D1
t
D2
15
20
25
30
35
40
Delay Time (nsec)
-100 -50 0 50 100 150
C
L
= 1000 pF
V
DD
= 18V
TEMPERATURE (°C)
t
D1
t
D2