NCP1050, NCP1051, NCP1052, NCP1053, NCP1054, NCP1055
www.onsemi.com
10
TYPICAL CHARACTERISTICS
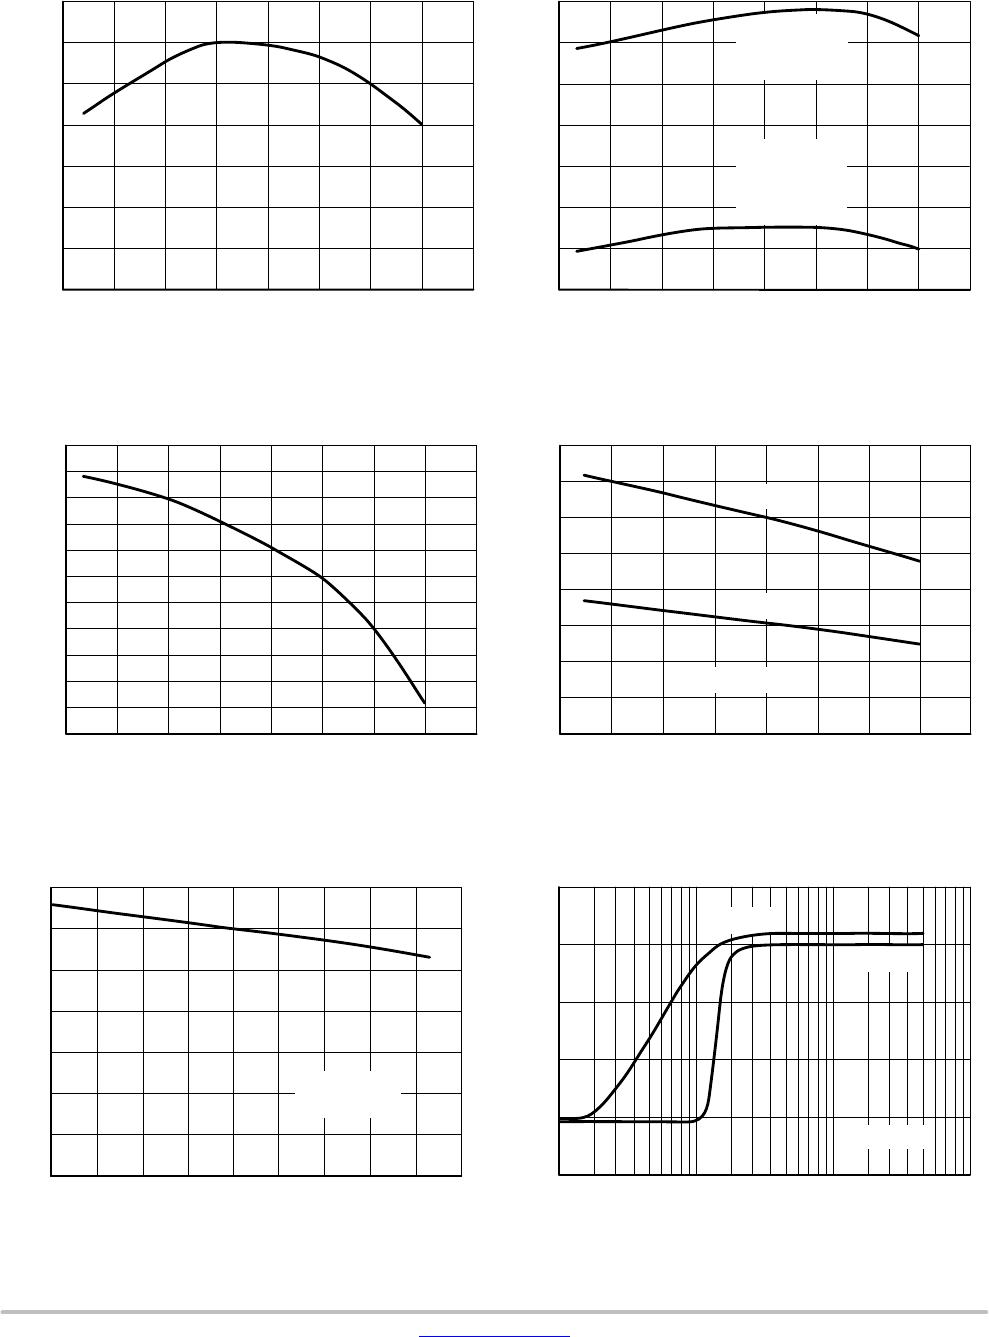
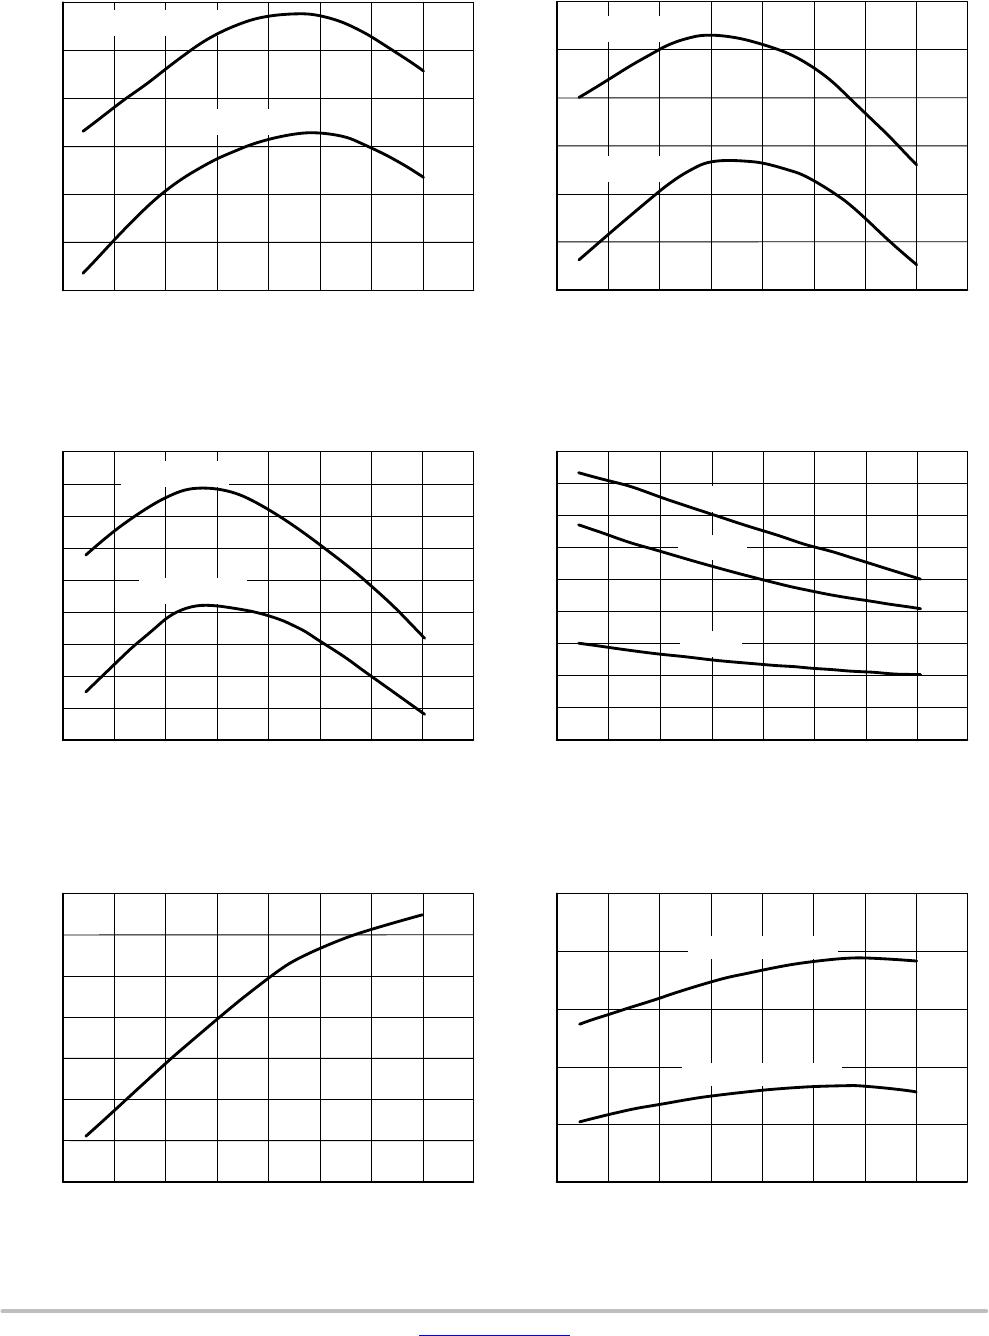
Figure 5. Oscillator Frequency
(44 kHz Version) versus Temperature
25 25 50 15012550 0 75 100
TEMPERATURE (°C)
40
41
42
43
44
45
46
OSCILLATOR FREQUENCY (kHz)
Figure 6. Oscillator Frequency
(100 kHz Version) versus Temperature
25 25 50 15012550 0 75 100
TEMPERATURE (°C)
92
94
96
100
102
104
OSCILLATOR FREQUENCY (kHz)
Figure 7. Oscillator Frequency
(136 kHz Version) versus Temperature
25 25 50 15012550 0 75 100
TEMPERATURE (°C)
124
126
OSCILLATOR FREQUENCY (kHz)
Figure 8. Frequency Sweep versus
Temperature
25 25 50 15012550 0 75 100
0
3
TEMPERATURE (°C)
4
5
6
7
8
9
FREQUENCY SWEEP (kHz)
V
CC
= V
CC(on)
98
128
130
132
134
136
138
140
136 kHz
Figure 9. Maximum Duty Cycle versus
Temperature
Figure 10. Lower Window Control Input
Current Thresholds versus Temperature
100 kHz
44 kHz
142
25 25 50 15012550 0 75 100
76.2
76.4
TEMPERATURE (°C)
76.6
76.8
77.0
77.2
77.4
77.6
MAXIMUM DUTY CYCLE (%)
25 25 50 15012550 0 75 100
35
TEMPERATURE (°C)
40
55
SINK CONTROL CURRENT THRESHOLD (A)
45
50
CURRENT RISING
CURRENT FALLING
V
CC
= V
CC(off)
V
CC
= V
CC(on)
V
CC
= V
CC(off)
V
CC
= V
CC(on)
V
CC
= V
CC(off)
2
1
30
NCP1050, NCP1051, NCP1052, NCP1053, NCP1054, NCP1055
www.onsemi.com
11
TYPICAL CHARACTERISTICS
Figure 11. Upper Window Control Input
Current Thresholds versus Temperature
50 25 50 1501250 100
30
TEMPERATURE (°C)
34
Figure 12. Control Input Lower Window Clamp
Voltage versus Temperature
25 25 50 15012550 0 75 100
1.28
1.29
TEMPERATURE (°C)
1.30
1.34
1.36
1.37
1.38
1.39
CLAMP VOLTAGE (V)
38
42
46
50
1.35
CURRENT RISING
CURRENT FALLING
I
SINK
= 25 A
SOURCE CONTROL CURRENT THRESHOLD (A)
Figure 13. Control Input Upper Window Clamp
Voltage versus Temperature
25 25 50 150125 50 0 75 100
4.52
4.54
TEMPERATURE (°C)
4.56
4.58
4.60
4.64
4.66
CLAMP VOLTAGE (V)
4.62
I
SOURCE
= 25 A
Figure 14. On Resistance versus Temperature
25 25 50 15012550 0 100
0
TEMPERATURE (°C)
10
20
30
40
45
ON RESISTANCE ()
NCP1050,1,2
(I
D
= 50 mA)
NCP1053,4,5
(I
D
= 100 mA)
Figure 15. Power Switch and Startup Circuit
Leakage Current versus Voltage
200 400 8000 600
0
APPLIED VOLTAGE (V)
20
40
80
100
120
LEAKAGE CURRENT (A)
60
Figure 16. Power Switch and Startup Circuit
Output Capacitance versus Applied Voltage
100 300 7006000 200 400 500
1
APPLIED VOLTAGE (V)
10
100
CAPACITANCE (pF)
T
J
= 40°C
T
J
= 25°C
T
J
= 125°C
T
J
= 25°C
NCP1053,4,5
NCP1050,1,2
1.31
1.33
1.32
25 75
5
15
25
35
75
100 300 700500 900
NCP1050, NCP1051, NCP1052, NCP1053, NCP1054, NCP1055
www.onsemi.com
12
TYPICAL CHARACTERISTICS
Figure 17. Normalized Peak Current Limit
versus Temperature
25 25 50 15012550 0 75 100
0.88
TEMPERATURE (°C)
0.90
0.92
NORMALIZED CURRENT LIMIT
0.94
0.96
0.98
1.00
1.02
Figure 18. Supply Voltage Thresholds versus
Temperature
25 25 50 150125 50 0 75 100
TEMPERATURE (°C)
7.2
7.4
SUPPLY THRESHOLD (V)
Figure 19. Undervoltage Lockout Threshold
versus Temperature
25 25 50 15012550 0 75 100
4.34
4.36
TEMPERATURE (°C)
4.38
4.40
4.42
4.52
4.54
4.56
UNDERVOLTAGE THRESHOLD (V)
7.6
7.8
8.0
8.2
8.4
8.6
STARTUP
THRESHOLD
V
CC(on)
MINIMUM
OPERATING
THRESHOLD
V
CC(off)
4.50
Figure 20. Start Current versus Temperature
25 25 50 15012550 0 75 100
0
TEMPERATURE (°C)
1
2
3
5
6
7
8
START CURRENT (mA)
4
V
CC
= 8.3 V
V
CC
= 0 V
Figure 21. Startup Current versus Supply
Voltage
134 9702 56
0
SUPPLY VOLTAGE (V)
1
2
3
5
6
7
STARTUP CURRENT (mA)
4
T
J
= 25°C
V
PIN
5
= 20 V
8
Figure 22. Startup Current versus Pin 5
Voltage
10 10001 100
2
PIN 5 VOLTAGE (V)
0
2
6
8
STARTUP CURRENT (mA)
4
T
J
= 25°C
V
CC
= 0 V
V
CC
= 8 V
4.44
4.46
4.48
V
PIN
5
= 20 V

NCP1050P100G

Mfr. #:
Manufacturer:
ON Semiconductor
Description:
AC/DC Converters 700V 100mA Switching No Auxillary Winding
Lifecycle:
New from this manufacturer.
Delivery:
DHL FedEx Ups TNT EMS
Payment:
T/T Paypal Visa MoneyGram Western Union