Data Sheets Sensitive SCRs
©2004 Littelfuse, Inc. E5 - 7 http://www.littelfuse.com
Thyristor Product Catalog +1 972-580-7777
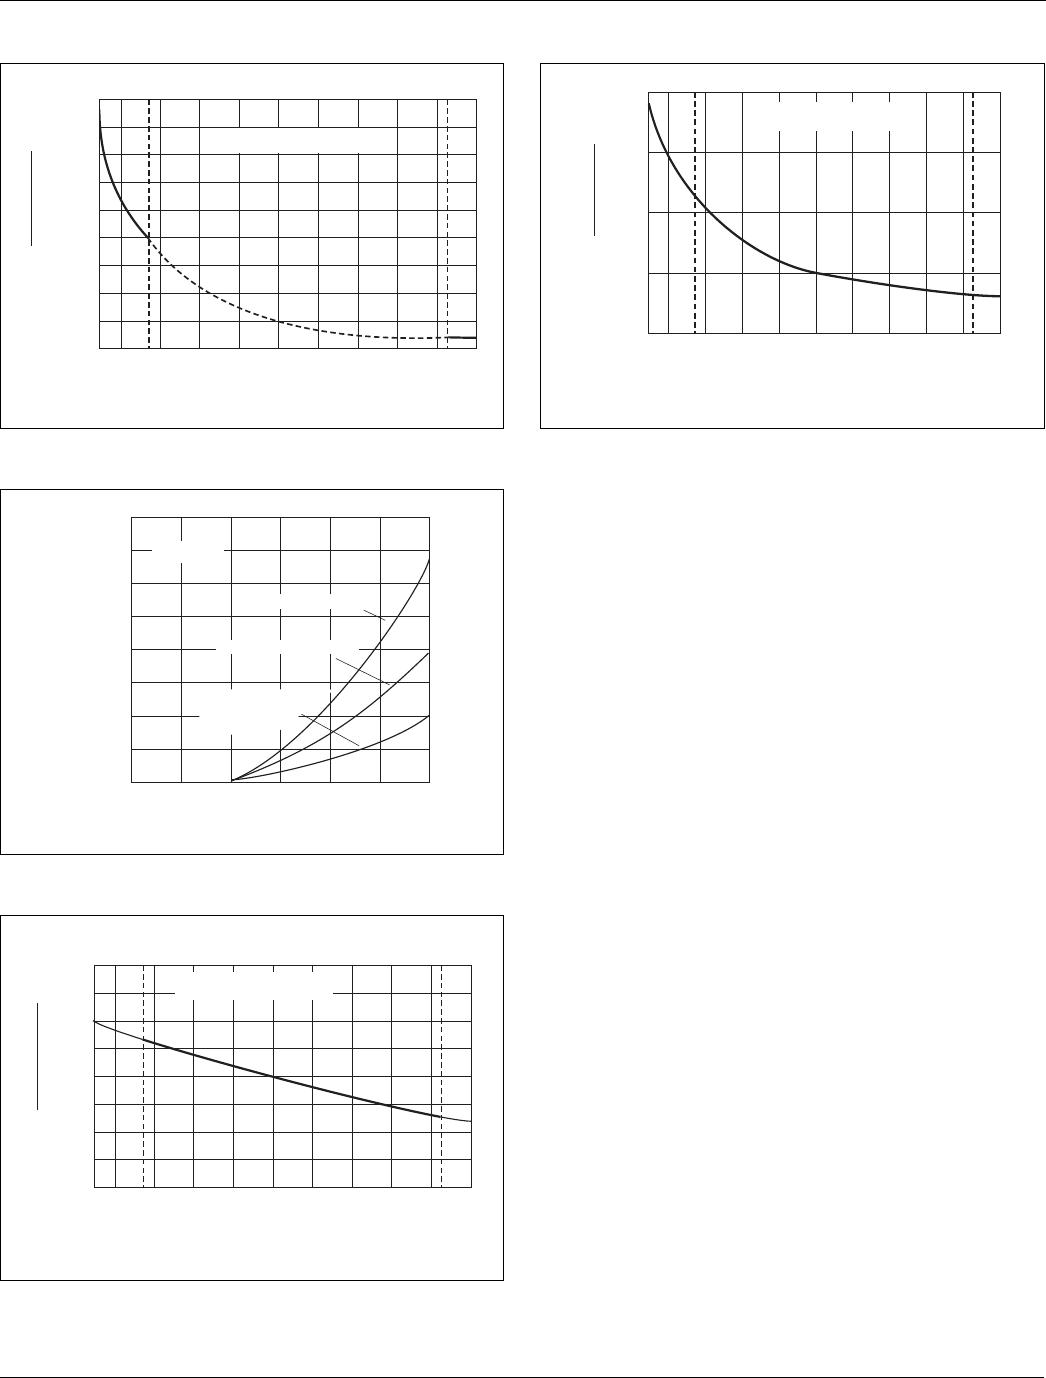
Figure E5.4 Maximum Allowable Case Temperature versus
Average On-state Current
Figure E5.5 Maximum Allowable Ambient Temperature versus
On-state Current
Figure E5.6 Maximum Allowable Ambient Temperature versus
RMS On-state Current
Figure E5.7 Maximum Allowable Ambient Temperature versus
Average On-state Current
Figure E5.8 Maximum Allowable Case Temperature versus
RMS On-state Current
Figure E5.9 Maximum Allowable Case Temperature versus
Average On-state Current
0 0.5 1.0 1.5 2.0 2.5 3.0
50
60
70
80
90
100
110
120
130
Average On-state Current [I
T(AV)
] – Amps
Maximum Allowable
Case Temperature (T
C
) – ˚C
0.95
40
CURRENT WAVEFORM: Sinusoidal
LOAD: Resistive or Inductive
CONDUCTION ANGLE: 180
˚
CASE TEMPERATURE: Measured
as Shown on Dimensional Drawing
1.65 1.9 2.54
T106 and T107
Type 1 and 3
T106 and T107
Type 2 and 4
TCR22
Devices
0 0.1 0.2 0.3 0.4 0.5 0.6 0.7 0.8 0.9
140
120
100
80
60
40
20
CURRENT WAVEFORM: Sinusoidal
LOAD: Resistive or Inductive
CONDUCTION ANGLE: 180
˚
FREE AIR RATING
1.5 A and JEDEC
2N Series I
T(AV)
and EC Series I
T(AV)
On-state Current – Amps
Maximum Allowable Ambient Temperature (T
A
) – ˚C
1.5 A Devices
and JEDEC
2N Series I
T(RMS)
EC Series I
T(RMS)
0 0.2 0.4 0.6 0.8 1.0 1.2 1.4 1.6 1.8
140
120
100
80
60
40
20
RMS On-state Current [I
T(RMS)
] – Amps
Maximum Allowable
Ambient Temperature (T
A
) – ˚C
2.0
CURRENT WAVEFORM: Sinusoidal
LOAD: Resistive or Inductive
CONDUCTION ANGLE: 180
˚
FREE AIR RATING
TO-220
T106/T107 TO-202
Type 1 and 3
T106/T107 TO-202
Type 2 and 4
and TO-251
0 0.2 0.4 0.6 0.8 1.0 1.2 1.4
20
40
60
80
100
120
140
CURRENT WAVEFORM: Sinusoidal
LOAD: Resistive or Inductive
CONDUCTION ANGLE: 180
˚
FREE AIR RATING
Average On-state Current [I
T(AV)
] – Amps
Maximum Allowable
Ambient Temperature (T
A
) – ˚C
TO-220
T106/T107 TO-202
Type 1 and 3
T106/T107 TO-202
Type 2 and 4
and TO-251
80
2468100
85
90
95
100
105
110
115
CURRENT WAVEFORM: Sinusoidal
LOAD: Resistive or Inductive
CONDUCTION ANGLE: 180
˚
TEMPERATURE: Measured as
Shown on Dimensional Drawings
RMS On-state Current [I
T(RMS)
] – Amps
Maximum Allowable
Case Temperature (T
C
) – ˚C
6 A TO-220
and TO-202
8 A TO-220
and TO-202
10 A TO-220
and TO-202
6 A TO-251
and TO-252
8 A TO-251
and TO-252
10 A TO-251
and TO-252
80
134560
85
90
95
100
105
110
Average On-state Current [I
T(AV)
] – Amps
Maximum Allowable
Case Temperature (T
C
) – ˚C
72
CURRENT WAVEFORM: Sinusoidal
LOAD: Resistive or Inductive
CONDUCTION ANGLE: 180
˚
CASE TEMPERATURE: Measured
as Shown on Dimensional Drawings
6 A TO-220
and TO-202
8 A TO-220
and TO-202
10 A TO-220
and TO-202
6 A TO-251
and TO-252
8 A TO-251
and TO-252
10 A TO-251
and TO-252
Sensitive SCRs Data Sheets
http://www.littelfuse.com E5 - 8 ©2004 Littelfuse, Inc.
+1 972-580-7777 Thyristor Product Catalog
Figure E5.10 Normalized DC Gate-Trigger Current versus
Case Temperature
Figure E5.11 Instantaneous On-state Current versus
On-state Voltage (Typical)
Figure E5.12 Normalized DC Gate-Trigger Voltage versus
Case Temperature
Figure E5.13 Normalized DC Holding Current versus Case Temperature
-65 -15 +25 +65 +110 +125-40
0
1.0
2.0
3.0
4.0
5.0
6.0
7.0
8.0
9.0
Case Temperature (T
C
) – ˚C
Ratio of
I
GT
I
GT
(T
C
= 25 ˚C)
See General Notes for specific device
operating temperature range.
0 .6 .8 1.0 1.2 1.4 1.6
0
4
8
12
16
20
24
28
32
T
C
= 25˚C
6 A to 10 A Devices
0.8 A to 1.5 A TO-92,
T106/T107, and
Compak
Instantaneous On-state Voltage (v
T
) – Volts
Instantaneous On-state Current (i
T
) – Amps
4 A TO-251 and TO-252
-65 -15 +25 +65 +110 +125-40
0
0.5
1.0
1.5
2.0
Case Temperature (T
C
) –
˚
C
Ratio of
V
GT
V
GT
(
T
C
= 25
˚
C)
See General Notes for specific
operating temperature range
-65 -40 -15 +25 +65 +110 +125
0
1.0
2.0
3.0
4.0
See General Notes for specific
operating temperature range.
Case Temperature (T
C
) – ˚C
Ratio of
I
H
I
H
(T
C
= 25 ˚C)
Data Sheets Sensitive SCRs
©2004 Littelfuse, Inc. E5 - 9 http://www.littelfuse.com
Thyristor Product Catalog +1 972-580-7777
Figure E5.14 Peak Surge On-state Current versus Surge Current Duration
Figure E5.15 Typical Turn-on Time versus Gate Trigger Current
Figure E5.16 Power Dissipation (Typical) versus RMS On-state Current
1 2 3 4 5 6 8 10 20 30 40 50 60 80100 200 300 400 600 100
0
1
2
3
4
5
6
8
10
20
30
40
50
60
80
100
200
SUPPLY FREQUENCY: 60 Hz Sinusoidal
LOAD: Resistive
RMS ON-STATE CURRENT: [I
T(RMS)
]: Max
Rated Value at Specified Case Temperature
Sur
g
e Current Duration – Full Cycles
Peak Surge (Non-repetitive)
On-state Current (I
TSM
) – Amps
Notes:
1) Gate control may be lost during
and immediately following surge
current interval.
2) Overload may not be repeated
until junction temperature has
returned to steady-state rated value.
6 A Devices
8 A Devices
10 A Devices
4 A TO-251 and TO-252
1.5 A Devices
TO-106
and TO-107
0.8 A TO-92
and Compak
0.01 0.1 1 10 100
0.1
1.0
10
100
I
GT
= 50 µA MAX
I
GT
= 200 µA MAX
I
GT
= 500 µA MAX
T
C
= 25 ˚C
I
GT
= 12 µA MAX
DC Gate Trigger Current (I
GT
) – mA
Turn-on Time (t
gt
) – µs
01234
1.0
2.0
3.0
4.0
5.0
T106 and T107
0.8 A TO-92 and Compak
1.5 A Devices
RMS On-state Current [I
T(RMS)
] – Amps
Average On-state Power Dissipation [P
D(AV)
] – Watts
CURRENT WAVEFORM: Half Sine Wave
LOAD: Resistive or Inductive
CONDUCTION ANGLE: 180˚
4 A TO-251 and TO-252

S2006FS211

Mfr. #:
Manufacturer:
Littelfuse
Description:
SCRs 6A 200V Sensing
Lifecycle:
New from this manufacturer.
Delivery:
DHL FedEx Ups TNT EMS
Payment:
T/T Paypal Visa MoneyGram Western Union