REVISION F 04/28/16 7 2-OUTPUT 1.8V PCIE GEN1/2/3 ZERO DELAY / FANOUT BUFFER
9DBV0231 DATASHEET
Electrical Characteristics–DIF 0.7V Low Power HCSL Outputs
Electrical Characteristics–Current Consumption
TA = T
AMB,
Supply Voltages per normal operation conditions, See Test Loads for Loading Conditions
PARAMETER SYMBOL CONDITIONS MIN TYP MAX UNITS NOTES
dV/dt Scope averaging on, fast setting 1.9 3.2 4
V/ns
1,2,3
dV/dt Scope averaging on, slow setting 1.4 2.3 3.3
V/ns
1,2,3
Slew rate matching
dV/dt Slew rate matching, Scope averaging on 5 20
%
1,2,4
Voltage High V
HIGH
660 779 850 7
Voltage Low V
LOW
-150 21 150 7
Max Voltage Vmax 835 1150 7
Min Voltage Vmin -300 -42 7
Crossing Voltage (abs) Vcross_abs Scope averaging off 250 409 550 mV 1,5
Crossing Voltage (var)
Δ
-Vcross Scope averaging off 14 140 mV 1,6
2
Measured from differential waveform
Slew rate
Statistical measurement on single-ended signal
using oscilloscope math function. (Scope
averaging on)
mV
Measurement on single ended signal using
absolute value. (Scope averaging off)
mV
7
At default SMBus settings.
1
Guaranteed by design and characterization, not 100% tested in production.
3
Slew rate is measured through the Vswing voltage range centered around differential 0V. This results in a +/-150mV window around
differential 0V.
4
Matching applies to rising edge rate for Clock and falling edge rate for Clock#. It is measured using a +/-75mV window centered on
the average cross point where Clock rising meets Clock# falling. The median cross point is used to calculate the voltage thresholds the
oscilloscope is to use for the edge rate calculations.
5
Vcross is defined as voltage where Clock = Clock# measured on a component test board and only applies to the differential rising
edge (i.e. Clock rising and Clock# falling).
6
The total variation of all Vcross measurements in any particular system. Note that this is a subset of Vcross_min/max (Vcross
absolute) allowed. The intent is to limit Vcross induced modulation by setting
Δ
-Vcross to be smaller than Vcross absolute.
TA = T
AMB,
Supply Voltages per normal operation conditions, See Test Loads for Loading Conditions
PARAMETER SYMBOL CONDITIONS MIN TYP MAX UNITS NOTES
I
DDA
VDDA+VDDR, PLL Mode, @100MHz
4.4 6
mA 1
I
DD
VDD, All outputs active @100MHz
14.2 18
mA 1
I
DDAP
D
VDDA+VDDR, PLL Mode, @100MHz
0.014 1 mA
1, 2
I
DDPD
VDD, Outputs Low/Low 0.9 1.4 mA 1, 2
1
Guaranteed by design and characterization, not 100% tested in production.
2
Input clock stopped.
Operating Supply Current
Powerdown Current
2-OUTPUT 1.8V PCIE GEN1/2/3 ZERO DELAY / FANOUT BUFFER 8 REVISION F 04/28/16
9DBV0231 DATASHEET
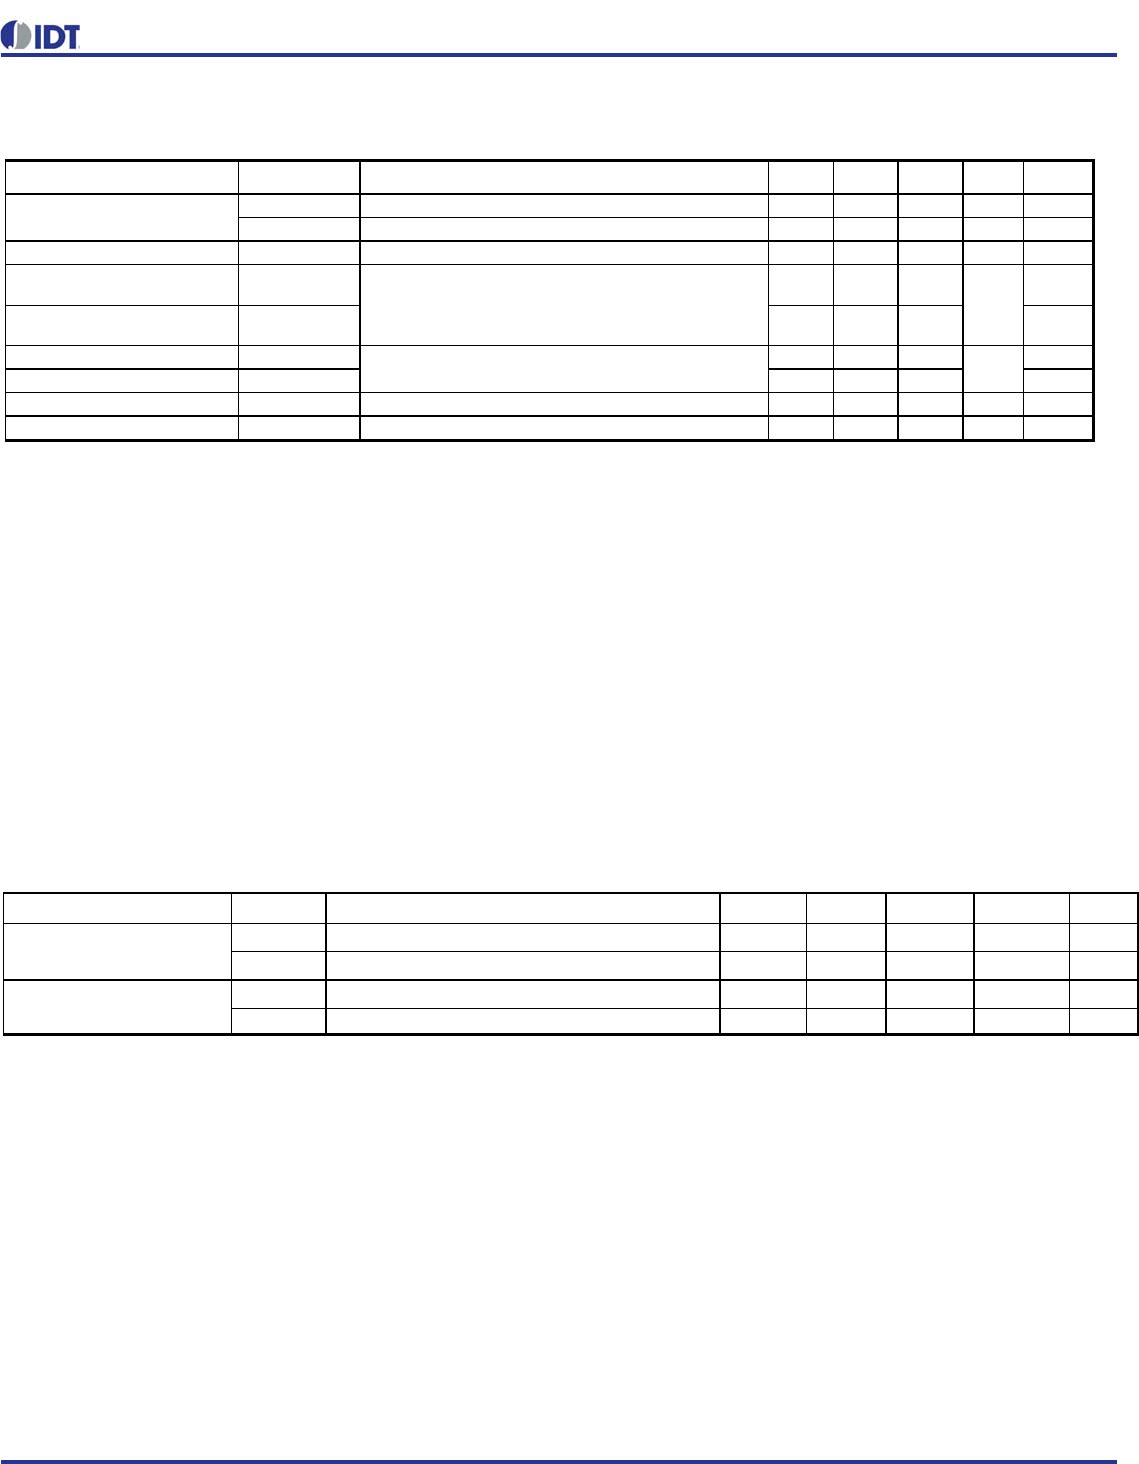
Electrical Characteristics–Output Duty Cycle, Jitter, Skew and PLL Characteristics
Electrical Characteristics–Phase Jitter Parameters
TA = T
AMB,
Supply Voltages per normal operation conditions, See Test Loads for Loading Conditions
PARAMETER SYMBOL CONDITIONS MIN TYP MAX UNITS NOTES
-3dB point in High BW Mode 2 2.7 4 MHz 1,5
-3dB point in Low BW Mode 1 1.4 2 MHz 1,5
PLL Jitter Peaking t
JPEAK
Peak Pass band Gain 1.05 2 dB 1
Duty Cycle t
D
C
Measured differentially, PLL Mode 45 50 55 % 1
Duty Cycle Distortion t
DCD
Measured differentially, Bypass Mode @100MHz -1 -0.1 1 % 1,3
t
p
dBYP
Bypass Mode, V
T
= 50% 2600 3370 4200 ps 1
t
p
dPLL
PLL Mode V
T
= 50% 0 112 200 ps 1,4
Skew, Output to Output t
sk3
V
T
= 50% 33 50 ps 1,4
PLL mode 13 50 ps 1,2
Additive Jitter in Bypass Mode 0.1 5 ps 1,2
1
Guaranteed by design and characterization, not 100% tested in production.
2
Measured from differential waveform
3
Duty cycle distortion is the difference in duty cycle between the output and the input clock when the device is operated in bypass mode.
4
All outputs at default slew rate
5
The MIN/TYP/MAX values of each BW setting track each other, i.e., Low BW MAX will never occur with Hi BW MIN.
PLL Bandwidth BW
Skew, Input to Output
Jitter, Cycle to cycle t
jcyc-cyc
TA = T
AMB,
Supply Voltages per normal operation conditions, See Test Loads for Loading Conditions
PARAMETER SYMBOL CONDITIONS MIN TYP MAX
INDUSTRY
LIMIT UNITS Notes
t
jp
hPCIeG1
PCIe Gen 1 32 52 86 ps (p-p) 1,2,3,5
PCIe Gen 2 Lo Band
10kHz < f < 1.5MHz
0.8 1.4 3
ps
(rms)
1,2,3,5
PCIe Gen 2 High Band
1.5MHz < f < Nyquist (50MHz)
2.4
2.5 3.1
ps
(rms)
1,2,3,5
t
jphPCIeG3
PCIe Gen 3
(PLL BW of 2-4 or 2-5MHz, CDR = 10MHz)
0.5
0.6 1
ps
(rms)
1,2,3,5
t
jphSGMII
125MHz, 1.5MHz to 10MHz, -20dB/decade
rollover < 1.5MHz, -40db/decade rolloff > 10MHz
1.9 2 NA
ps
(rms)
1,6
t
jphPCIeG1
PCIe Gen 1 0.1 5 N/A ps (p-p) 1,2,3,5
PCIe Gen 2 Lo Band
10kHz < f < 1.5MHz
0.2 0.3 N/A
ps
(rms)
1,2,3,4,
5
PCIe Gen 2 High Band
1.5MHz < f < Nyquist (50MHz)
0.00 0.1 N/A
ps
(rms)
1,2,3,4
t
jphPCIeG3
PCIe Gen 3
(PLL BW of 2-4 or 2-5MHz, CDR = 10MHz)
0.00 0.1 N/A
ps
(rms)
1,2,3,4
t
jphSGMII
125MHz, 1.5MHz to 10MHz, -20dB/decade
rollover < 1.5MHz, -40db/decade rolloff > 10MHz
165 200 N/A
ps
(rms)
1,6
t
jphSGMII
125MHz, 12kHz to 20MHz, -20dB/decade rollover
< 1.5MHz, -40db/decade rolloff > 10MHz
251 300 N/A
ps
(rms)
1,6
1
Guaranteed by design and characterization, not 100% tested in production.
4
For RMS figures, additive jitter is calculated by solving the following equation: Additive jitter = SQRT[(total jitter)^2 - (input jitter)^2]
5
Driven by 9FG432 or equivalent
6
Rohde&Schartz SMA100
Phase Jitter, PLL Mode
t
jphPCIeG2
t
jphPCIeG2
2
See http://www.pcisig.com for complete specs
3
Sample size of at least 100K cycles. This figures extrapolates to 108ps pk-pk @ 1M cycles for a BER of 1-12.
Additive Phase Jitter,
Bypass Mode
REVISION F 04/28/16 9 2-OUTPUT 1.8V PCIE GEN1/2/3 ZERO DELAY / FANOUT BUFFER
9DBV0231 DATASHEET
Additive Phase Jitter Plot: 125M (12kHz to 20MHz)
RMSadditvejitter:251fs

9DBV0231AKILFT

Mfr. #:
Manufacturer:
IDT
Description:
Clock Buffer 2 O/P 1.8V PCIE BUFFER
Lifecycle:
New from this manufacturer.
Delivery:
DHL FedEx Ups TNT EMS
Payment:
T/T Paypal Visa MoneyGram Western Union

Products related to this Datasheet