Data Sheet ADuM4120/ADuM4120-1
Rev. 0 | Page 13 of 17
APPLICATIONS INFORMATION
PCB LAYOUT
The ADuM4120/ADuM4120-1 digital isolators require no
external interface circuitry for the logic interfaces. Power supply
bypassing is required at the input and output supply pins, as shown
in Figure 21. Use a small ceramic capacitor with a value between
0.01 µF and 0.1 µF to provide an adequate high frequency bypass.
On the output power supply pin, V
DD1
, it is recommended to also
add a 10 µF capacitor to provide the charge required to drive
the gate capacitance at the ADuM4120/ADuM4120-1 outputs.
Avoid the use of vias on the output supply pin and the bypass
capacitor, or employ multiple vias to reduce the inductance in
the bypassing. The total lead length between both ends of the
smaller capacitor and the input or output power supply pin
must exceed 20 mm.
DD1
V
IN
V
OUT
GND
1
V
DD2
GND
2
15493-121
Figure 21. Recommended PCB Layout
PROPAGATION DELAY RELATED PARAMETERS
Propagation delay is a parameter that describes the time it takes
a logic signal to propagate through a component. The propagation
delay to a logic low output can differ from the propagation delay to
a logic high output. The ADuM4120/ADuM4120-1 specify t
DLH
(see Figure 22) as the time between the rising input high logic
threshold, V
IH
, to the output rising 10% threshold. Likewise, the
falling propagation delay, t
DHL
, is defined as the time between the
input falling logic low voltage threshold, V
IL
, and the output
falling 90% threshold. The rise and fall times are dependent on
the loading conditions and are not included in the propagation
delay, as is the industry standard for gate drivers.
OUTPUT
INPUT
t
DLH
t
R
90%
10%
V
IH
V
IL
t
F
t
DHL
15493-122
Figure 22. Propagation Delay Parameters
Channel to channel matching refers to the maximum amount
that the propagation delay differs between channels within a
single ADuM4120/ADuM4120-1 component.
Propagation delay skew refers to the maximum amount that
the propagation delay differs between multiple
ADuM4120/ADuM4120-1 components operating under the
same conditions.
THERMAL LIMITATIONS AND SWITCH LOAD
CHARACTERISTICS
For isolated gate drivers, the necessary separation between the
input and output circuits prevents the use of a single thermal
pad beneath the device. Therefore, heat dissipates mainly
through the package pins.
If the internal junction temperature (θ
JA
) of the device exceeds
the TSD threshold, the output is driven low to protect the device.
Operation above the recommended operating ranges is not
guaranteed to be within the specifications shown in Table 1.
UNDERVOLTAGE LOCKOUT (UVLO)
The ADuM4120/ADuM4120-1 have UVLO protections for
both the primary and secondary side of the device. If either the
primary or secondary side voltages are less than the falling edge
UVLO, the device outputs a low signal. After the ADuM4120/
ADuM4120-1 are powered above the rising edge UVLO
threshold, the devices are able to output the signal found at the
input. Hysteresis is built in to the UVLO to account for small
voltage source ripple. The primary side UVLO thresholds are
common among all models. Three options for the secondary
output UVLO thresholds are listed in Table 11.
Table 11. List of Model Options
Model Number Glitch Filter UVLO (V)
ADuM4120ARIZ Enabled 4.4
ADuM4120BRIZ Enabled 7.3
ADuM4120CRIZ Enabled 11.3
ADuM4120-1ARIZ Disabled 4.4
ADuM4120-1BRIZ Disabled 7.3
ADuM4120-1CRIZ Disabled 11.3
ADuM4120/ADuM4120-1 Data Sheet
Rev. 0 | Page 14 of 17
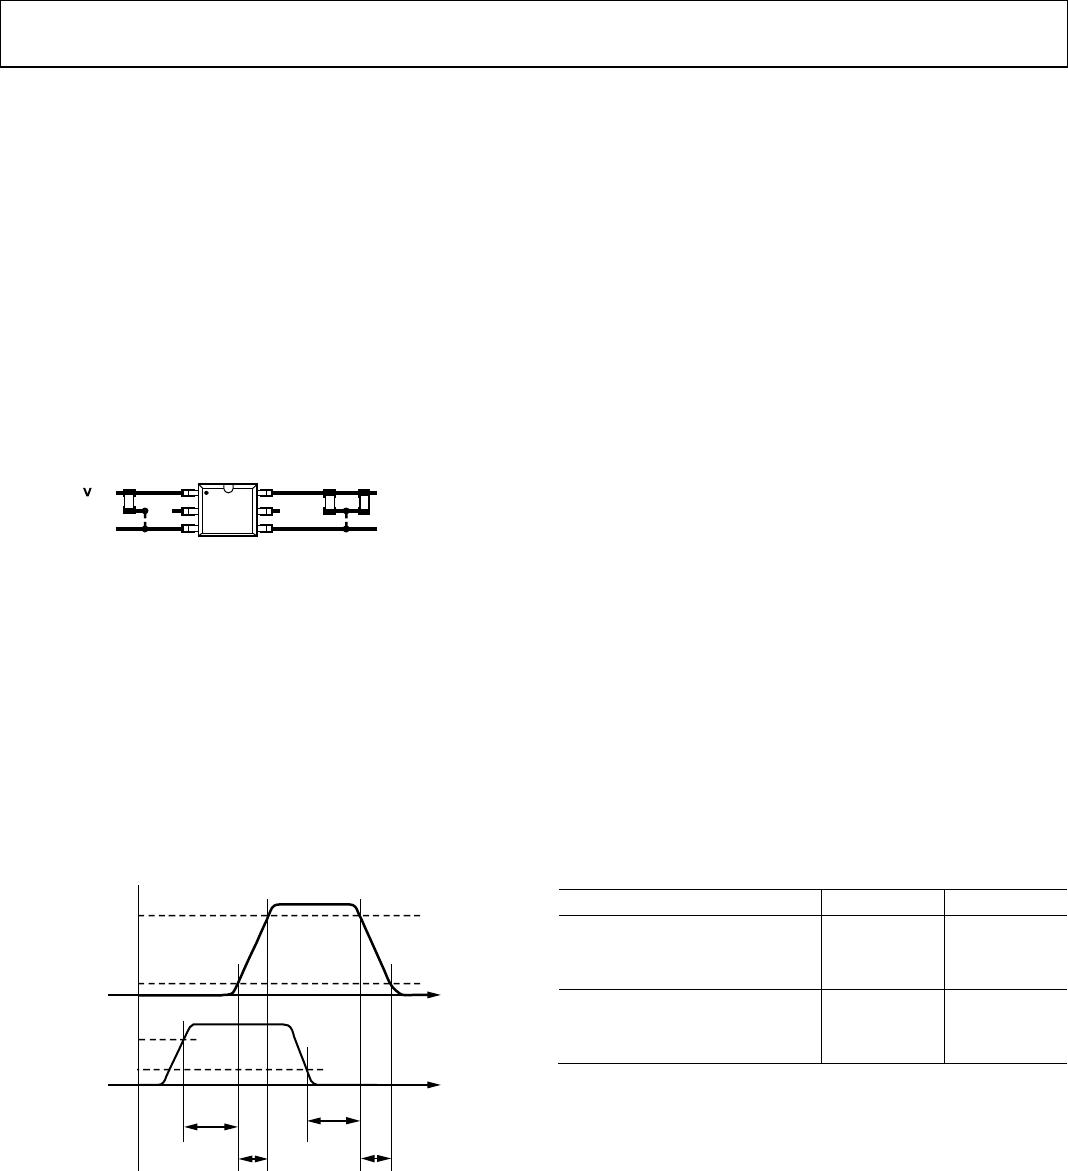
OUTPUT LOAD CHARACTERISTICS
The ADuM4120/ADuM4120-1 output signals depend on the
characteristics of the output load, which is typically an N-channel
MOSFET. The driver output response to an N-channel MOSFET
load can be modeled with a switch output resistance (R
SW
), an
inductance due to the PCB trace (L
TRACE
), a series gate resistor
(R
GATE
), and a gate to source capacitance (C
GS
), as shown in
Figure 23.
R
SW
is the switch resistance of the internal ADuM4120/
ADuM4120-1 driver output, which is about 1.5 Ω. R
GATE
is the intrinsic gate resistance of the MOSFET and any external
series resistance. A MOSFET that requires a 4 A gate driver has
a typical intrinsic gate resistance of about 1 Ω and a gate to source
capacitance, C
GS
, of between 2 nF and 10 nF. L
TRACE
is the induct-
ance of the PCB trace, typically a value of 5 nH or less for a well
designed layout with a very short and wide connection from the
ADuM4120/ADuM4120-1 output to the gate of the MOSFET.
The following equation defines the Q factor of the resistor
inductor capacitor (RLC) circuit, which indicates how the
ADuM4120/ADuM4120-1 output responds to a step change.
For a well damped output, Q is less than one. Adding a series
gate resistance dampens the output response.
GS
TRACE
GATE
SW
C
L
RR
Q
)(
1
In Figure 4 and Figure 6, the ADuM4120/ADuM4120-1 output
waveforms for a 15 V output are shown for a C
GS
value of 2 nF
and 5  resistance. The ringing of the output in Figure 5 and
Figure 7 with C
GS
of 2 nF and no external resistor has a
calculated Q factor of 1.5, where less than one is desired for
adequate damping to prevent overshoot.
Output ringing can be reduced by adding a series gate resistance
to dampen the response. For applications using a 1 nF or less
load, it is recommended to add a series gate resistor of about
5 Ω. As shown in Figure 23, R
GATE
is 5 Ω, which yields a calculated
Q factor of about 0.7 which is well damped
ADuM4120/
ADuM4120-1
V
IN
V
OUT
R
SW
R
GATE
C
GS
L
TRACE
V
15493-123
Figure 23. RLC Model of the Gate of an N-Channel MOSFET
POWER DISSIPATION
During the driving of a MOSFET or IGBT gate, the driver must
dissipate power. This power is significant and can lead to TSD if
considerations are not made. The gate of an IGBT can be
roughly simulated as a capacitive load. With this value, the
estimated total power dissipation, P
DISS
, in the system due to
switching action is given by the following equation:
P
DISS
= C
EST
× (V
DD2
GND
2
)
2
× fs
where:
C
EST
= C
ISS
× 5.
fs is the switching frequency of IGBT.
This power dissipation is shared between the internal on
resistances of the internal gate driver switches, and the external
gate resistances, R
GON
and R
GOFF
. The ratio of the internal gate
resistances to the total series resistance allows the calculation of
losses seen within the ADuM4120/ADuM4120-1 chip.
P
DISS_ADuM4120/ADuM4120-1
= P
DISS
× 0.5((R
DSON_P
/(R
GON
+ R
DSON_P
)) +
(R
DSON_N
/(R
GOFF
+ R
DSON_N
))
Taking this power dissipation found inside the chip and
multiplying it by the θ
JA
gives the rise above ambient temperature
that the ADuM4120/ADuM4120-1 experiences.
T
ADuM4120/ADuM4120-1
= θ
JA
× P
DISS_ADuM4120
+ T
A
For the device to remain within specification, T
ADUM4120
cannot
exceed 125°C. If T
ADuM4120
exceeds the thermal shutdown (TSD),
rising edge, the device enters TSD and the output remains low
until the TSD falling edge is crossed.
DC CORRECTNESS AND MAGNETIC FIELD IMMUNITY
The ADuM4120/ADuM4120-1 is resistant to external magnetic
fields. The limitation on the ADuM4120/ADuM4120-1
magnetic field immunity is set by the condition in which
induced voltage in the transformer receiving coil is sufficiently
large to either falsely set or reset the decoder. The following
analysis defines the conditions under which a false reading
condition can occur. The 2.3 V operating condition of the
ADuM4120/ADuM4120-1 is examined because it represents
the most susceptible mode of operation.
100
10
1
0.1
0.01
0.001
1k 10k 100k 1M 10M 100M
MAXIMUM ALLOWABLE MAGNETIC FLUX
DENSITY (kgauss)
MAGNETIC FIELD FREQUENCY (Hz)
15493-021
Figure 24. Maximum Allowable External Magnetic Flux Density
Data Sheet ADuM4120/ADuM4120-1
Rev. 0 | Page 15 of 17
1k
100
10
1
0.1
0.01
1k 10k 100k 1M 10M 100M
MAXIMUM ALLOWABLE CURRENT (kA)
MAGNETIC FIELD FREQUENCY (Hz)
DISTANCE = 1m
DISTANCE = 100mm
DISTANCE = 5mm
15493-022
Figure 25. Maximum Allowable Current for Various Current to
ADuM4120/ADuM4120-1 Spacings
INSULATION LIFETIME
All insulation structures eventually break down when subjected
to voltage stress over a sufficiently long period. The rate of
insulation degradation is dependent on the characteristics of the
voltage waveform applied across the insulation, as well as on the
materials and material interfaces.
Two types of insulation degradation are of primary interest:
breakdown along surfaces exposed to air and insulation wear
out. Surface breakdown is the phenomenon of surface tracking
and the primary determinant of surface creepage requirements
in system level standards. Insulation wear out is the phenomenon
where charge injection or displacement currents inside the
insulation material cause long-term insulation degradation.
Surface Tracking
Surface tracking is addressed in electrical safety standards by
setting a minimum surface creepage based on the working
voltage, the environmental conditions, and the properties of the
insulation material. Safety agencies perform characterization
testing on the surface insulation of components that allows the
components to be categorized in different material groups.
Lower material group ratings are more resistant to surface
tracking and therefore can provide adequate lifetime with
smaller creepage. The minimum creepage for a given working
voltage and material group is in each system level standard and
is based on the total rms voltage across the isolation, pollution
degree, and material group. The material group and creepage
for the ADuM4120/ADuM4120-1 isolators are shown in Table 4.
Insulation Wear Out
The lifetime of insulation caused by wear out is determined by
its thickness, material properties, and the voltage stress applied.
It is important to verify that the product lifetime is adequate at
the application working voltage. The working voltage supported
by an isolator for wear out may not be the same as the working
voltage supported for tracking. The working voltage applicable
to tracking is specified in most standards.
Testing and modeling show that the primary driver of long-
term degradation is displacement current in the polyimide
insulation causing incremental damage. The stress on the insulation
can be broken down into broad categories, such as dc stress, which
causes very little wear out because there is no displacement
current, and an ac component time varying voltage stress,
which causes wear out.
The ratings in certification documents are usually based on 60 Hz
sinusoidal stress because this stress reflects isolation from line
voltage. However, many practical applications have combinations
of 60 Hz ac and dc across the barrier as shown in Equation 1.
Because only the ac portion of the stress causes wear out, the
equation can be rearranged to solve for the ac rms voltage, as
shown in Equation 2. For insulation wear out with the polyimide
materials used in this product, the ac rms voltage determines
the product lifetime.
22
DCRMSACRMS
VVV
(1)
or
22
DCRMSRMSAC
VVV
(2)
where:
V
RMS
is the total rms working voltage.
V
AC RMS
is the time varying portion of the working voltage.
V
DC
is the dc offset of the working voltage.
Calculation and Use of Parameters Example
The following is an example that frequently arises in power
conversion applications. Assume that the line voltage on one
side of the isolation is 240 V ac rms, and a 400 V dc bus voltage
is present on the other side of the isolation barrier. The isolator
material is polyimide. To establish the critical voltages in
determining the creepage clearance and lifetime of a device,
see Figure 26 and the following equations.

ADUM4120-1ARIZ

Mfr. #:
Manufacturer:
Analog Devices Inc.
Description:
Gate Drivers Iso Gate Drvr w/2A output
Lifecycle:
New from this manufacturer.
Delivery:
DHL FedEx Ups TNT EMS
Payment:
T/T Paypal Visa MoneyGram Western Union