Data Sheet AD7400A
Rev. D | Page 3 of 20
SPECIFICATIONS
V
DD1
= 4.5 V to 5.5 V, V
DD2
= 3 V to 5.5 V, V
IN
+ = −200 mV to +200 mV, except where specified, and V
IN
− = 0 V (single-ended);
T
A
= −40°C to +125°C, except where specified; f
MCLK
= 10 MHz, tested with Sinc
3
filter, 256 decimation rate, as defined by Verilog code,
unless otherwise noted.
Table 1.
Y Version
1
Parameter Min Typ Max Unit Test Conditions/Comments
STATIC PERFORMANCE
Resolution
16 Bits Filter output truncated to 16 bits
Integral Nonlinearity
2
±2 ±12 LSB V
IN
+ = ±200 mV, T
A
= −40°C to +125°C
IN
A
±4 ±22 LSB V
IN
+ = ±250 mV, T
A
= −40°C to +125°C
Differential Nonlinearity
2
±0.9 LSB Guaranteed no missing codes to 16 bits
Offset Error
2
±50 ±500 μV
Offset Drift vs. Temperature
1.5 4 µV/°C −40°C to +125°C
Offset Drift vs. V
DD1
120 µV/V
Gain Error
2
±1.5 mV −40°C to +85°C
±2 mV −40°C to +125°C
Gain Error Drift vs. Temperature 23 µV/°C −40°C to +125°C
Gain Error Drift vs. V
DD1
110 µV/V
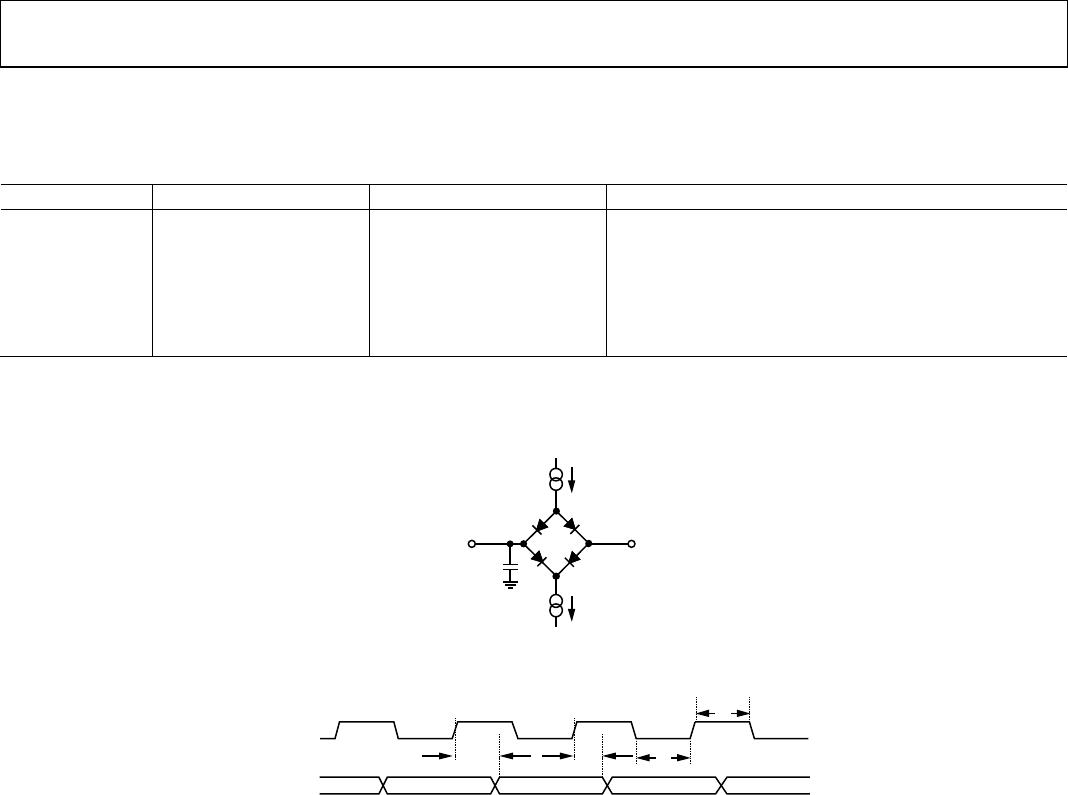
ANALOG INPUT
Input Voltage Range
−250 +250 mV For specified performance, full range = ±320 mV
Dynamic Input Current ±7 ±8 µA V
IN
+ = 400 mV, V
IN
− = 0 V
±9 ±10 µA V
IN
+ = 500 mV, V
IN
− = 0 V
±0.5 µA V
IN
+ = V
IN
− = 0 V
Input Capacitance 10 pF
DYNAMIC SPECIFICATIONS V
IN
+ = 35 Hz
Signal-to-Noise and Distortion (SINAD) Ratio
2
70 78 dB V
IN
+ = ±200 mV
68 78 dB V
IN
+ = ±250 mV
Signal-to-Noise Ratio (SNR) 73 80 dB V
IN
+ = ±200 mV
72 80 dB V
IN
+ = ±250 mV
Total Harmonic Distortion (THD)
2
−84 dB V
IN
+ = ±200 mV
IN
Peak Harmonic or Spurious Noise (SFDR)
2
−86 dB V
IN
+ = ±200 mV
−84 dB V
IN
+ = ±250 mV
Effective Number of Bits (ENOB)
2
11.5 12.5 Bits V
IN
+ = ±200 mV
11 12.5 Bits V
IN
+ = ±250 mV
Isolation Transient Immunity
2
25 30 kV/µs
LOGIC OUTPUTS
Output High Voltage, V
OH
V
DD2
− 0.1 V I
O
= −200 µA
Output Low Voltage, V
OL
0.4 V I
O
= +200 µA
POWER REQUIREMENTS
V
DD1
4.5 5.5 V
V
DD2
3 5.5 V
I
DD1
3
11 13 mA V
DD1
= 5.5 V
I
DD2
4
4.5 6 mA V
DD2
= 5.5 V
3 3.5 mA V
DD2
= 3.3 V
1
All voltages are relative to their respective ground.
2
See the Terminology section.
3
See Figure 14.
4
See Figure 15.